


[Reminder: If you haven't done so already, please fill out my course survey, at https://www.surveymonkey.com/r/2024-learn-survey ! I'll be announcing new Python and Pandas courses next week, and this is your chance to influence the topics that I'll teach. ]
The 2024 Olympic Games are on! This massive sporting event gives us a chance to think about friendly competition among countries, rather than the economic, social, and political problems that we face in our day-to-day lives.
Of course, here at Bamboo Weekly, we're less interested in the sports than the data about the sports. And with something as big as the Olympics, you can be sure that huge amounts of data are being generated – per team, athlete, sport, and event.
This week, we thus looked this week at data coming from the Olympics. Unless you're doing these exercises after the games close in mid-August 2024, you should expect that even if your queries are exactly the same as mine, you might well get different data, as the numbers are updated.
Data and six questions
This week's data came from two different sources:
- The main data comes from from Codante (https://codante.io/), a Brazilian company that offers free API to Olympic information. This is free, so it's limited to 100 requests/minute (which should be more than enough). If they feel that you're making too many requests, then they might block you IP address, so please be nice to them. The API is documented at https://docs.apis.codante.io/olympic-games-english .
- Geographic data about the Olympic venues come from Clockwork Micro (https://www.clockworkmicro.com/), which made shapefiles available in a GitHub repository at https://github.com/clockworkmicro/parisolympics2024 .
We'll also use the pycountry package on PyPI (https://pypi.org/project/pycountry/).
Here are this week's six tasks and questions. As always, the Jupyter notebook that I used to solve the problems are at the bottom of this post.
Using the API from apis.codante.io, download all of the per-country medal information. As of this writing, the country API has a total of five pages to download; you'll want to combine them into a single data frame. Set the index to be the 3-letter country ID.
Before doing anything else, I loaded Pandas and a few other modules and names:
import pandas as pd
from pandas import Series, DataFrame
import requests
import pycountry
Why did I import each of these?
- Obviously, I imported
pandasso that I could analyze the data. - I then imported the specific names
SeriesandDataFrame, which are convenient if and when I want to create a series. - I'll be using
requeststo perform API calls. - Finally, I'll be using
pycountry(installed from PyPI) for country-specific information.
With that in place, I can start to retrieve Olympics data via the API. The easiest way to do this is with requests, since I can just say requests.get(URL), for a given URL. In the case of this API, though, we'll need to retrieve five pages of data, with each page (according to the API documentation) specified by passing a page name-value pair along with an integer.
We can do that with requests by passing not only the URL, but also {'pages':1}, a dict containing the key-value pairs we want to add to our request. The integer passed along with 'pages' will have to change, with values 1-5, as we retrieve each page of results.
The results themselves will come as JSON. Fortunately, we can easily turn most JSON data into a data frame by simply passing it to DataFrame. We'll thus end up with one data frame for each page. If we create a list of data frames, we can then combine them into a single one with pd.concat.
Let's start by setting up a base URL and an empty list, all_data, where we'll collect the data frames:
url_base = 'https://apis.codante.io/olympic-games'
all_data = []
Next, we'll use requests to retrieve each of the five pages:
for page_number in range(1, 6):
    print(f'Getting page {page_number}')
    r = requests.get(f'{url_base}/countries', {'page':page_number})
    all_data.append(DataFrame(r.json()['data']))
Notice that when we get a response back from requests, we can invoke json on it to get Python data structures (lists and dicts). I originally tried to invoke DataFrame directly on the result of invoking r.json(), but saw that the actual data was under the 'data' dict key. So I ran DataFrame(r.json()['data']), giving me a data frame; I then appended it to all_data.
Notice that I added a call to print, indicating what page was being retrieved in each iteration of the for loop. I often do that when things will take a while, so that I can know where the code stands – and where it had a problem, if something goes wrong.
Note that I used range(1,6) to iterate over the numbers I wanted, starting with 1 and ending with 5 – because range, like most Python methods, always counts "up to and not including" the final value.
With all_data in place, I ran pd.concat on it, and then ran set_index to use id as the index on the new data frame:
df = (pd
      .concat(all_data)
      .set_index('id')
     )
The resulting data frame has 203 rows and 9 columns.
What countries don't seem to have any continent? What's the deal with them?
While exploring this data set, I decided to see how many countries are on each continent:
df['continent'].value_counts()I got the following result:
continent
AFR    53
EUR    47
ASI    44
AME    41
OCE    15
        2
-       1
Name: count, dtype: int64
I could identify the first five continents, but didn't understand what the blank continent was, or the one marked with -. I thus did some digging:
(
    df
    .loc[
        lambda df_: df_['continent'].isin(['', '-']),
        ['continent', 'name']
      ]
)
In the above code, I use loc to retrieve a subset of rows and columns
For the row selector, I used lambda, creating an anonymous function that takes a single argument, a data frame. We then, inside of the function, run isin(['', '-']) on the data frame, getting a boolean series back. The series is True when the continent is either an empty string or just -. Specifying a boolean series in this way is often more natural and flexible than other methods.
For the column selector, I pass a list of strings, the names of the columns we want to see.
The result:
    continent   name
id
EOR              EOR
AIN              AIN
SAM         -  Samoa
We thus see that three of the teams competing in the Olympics have no continent. Which are they?
- Samoa, a country that I think would classify itself as being in Oceania, much like Australia and New Zealand. I'm guessing (hoping) that the data I got was just a glitch.
- EOR, a team of Olympic athletes who are refugees. This team has participated in Olympic games since 2016, and was previously known as ROT, for "Refugee Olympic Team." France insisted that the team be known by its French initials this time around, and the acronym for "Équipe olympique des réfugiés" is EOR.
- AIN, a team of Russian and Belorusian athletes, since their national teams were banned in the wake of Russia's invasion of Ukraine. In English, they were known as INA ("Individual Neutral Athletes"), but this year they are known by AIN, the French initials of "Athlètes Individuels Neutres."
I had no idea about these latter two groups, and am glad that I got a chance to learn about them.
Show how many medals of each type (gold, silver, and bronze) were won by each continent. If no continent is listed for a country, then replace it with "other". Sort the results by the number of gold, then silver, then bronze medals in descending order.
To start off, we'll get a subset of the data frame's columns:
(
    df
    [['continent', 'gold_medals', 'silver_medals', 'bronze_medals']]
)
We can then use the replace method to replace the empty string and - with the string 'other'. We do this by passing replace a dict in which the original values are the keys, and the replacement
(
    df
    [['continent', 'gold_medals', 'silver_medals', 'bronze_medals']]
    .replace({'':'other', '-':'other'})
)
I asked you to sum the number of medals of each type for each continent. That's a grouping operation, because we want to apply an aggregation method (sum) on a numeric column (the number of medals), grouped by each unique value in a categorical column (continent).
But wait, we have three different columns for medals. How can we run groupby on those? The answer is still to pass continent, a categorical column, as an argument to groupby, but to then give a list of numeric columns just after that call:
(
    df
    [['continent', 'gold_medals', 'silver_medals', 'bronze_medals']]
    .replace({'':'other', '-':'other'})
    .groupby('continent')[['gold_medals',
                           'silver_medals', 'bronze_medals']].sum()
)
This gives us the right answer, but I asked for it to be sorted in descending order, first by the number of gold medals, then by the number of silver medals, and finally by the number of bronze medals. We can do that by invoking sort_values , telling it to sort by those three columns, and passing the ascending=False keyword argument:
(
    df
    [['continent', 'gold_medals', 'silver_medals', 'bronze_medals']]
    .replace({'':'other', '-':'other'})
    .groupby('continent')[['gold_medals',
                           'silver_medals', 'bronze_medals']].sum()
    .sort_values(['gold_medals',
                  'silver_medals', 'bronze_medals'], ascending=False)
)
As of this writing, here are the results that I got from that query:
           gold_medals  silver_medals  bronze_medals
continent
EUR                 31             38             44
ASI                 29             16             18
AME                 11             18             20
OCE                  9              9              5
AFR                  1              1              3
other                0              0              0
We don't have any two continents with the same number of gold medals, so we don't see the effect of the second- and third-column sorting. However, when I first composed this question, Asia and Europe had the same number of gold medals, and the sorting was informative.
The name column contains the name of each country in Brazilian Portuguese, which makes sense for a Brazilian
company to do. But it would be nice to have the English-language name instead. Use the pycountry package to
convert the names to English names wherever possible. Where there is no English name, just keep the three-letter
abbreviation. (And apologies to my Brazilian readers!)
The key to getting this to work was to understand that the three-letter country code (i.e., the id column in our data frame, currently being used as our index) allows us to retrieve country information from the pycountry package.
To start, let's create a dictionary in which the keys and values are both the three-letter codes. I know that this seems weird, but stick with me. I'll use a dict comprehension to do this:
olympic_codes = { country_code : country_code
   for country_code in df.index}
Next, I'll create another dictionary, again using a dict comprehension. This will also have the three-letter codes as keys, but will grab the country names from the pycountry package:
{
    one_country.alpha_3 : one_country.name
    for one_country in pycountry.countries
}
Now I'll merge them, using the | operator, available in the most recent versions of Python. When we merge two dicts, we get back a new one. The right-hand dict has priority over the left-hand one. I'll thus do this:
olympic_codes = { country_code : country_code
   for country_code in df.index}

countries = olympic_codes | {
    one_country.alpha_3 : one_country.name
    for one_country in pycountry.countries
}
In other words, the countries dict will have the three-letter country codes as keys. If there's a country name in pycountry, it'll be the value. If not, then we'll use the three-letter Olympic code.
With this in place, we can now use assign to create a new column on our data frame. The value of the data frame will be the result of invoking map on the index (i.e., id column). If you pass a dict to map, it replaces the keys with the values:
df = (
    df
    .assign(name_en = df.index.map(countries))
)
The result? Our data frame df now has a new name_en column in which the names are in English – except where pycountry has no three-letter code, in which case the code remains.
Download the shape data (as a zipfile or with "git clone"). Read the shapefile for the torch relay into GeoPandas, and display the route of the Olympic torch as lines on a map.
Next, we'll turn to a different data set and a different set of techniques. I've recently become increasingly interested in GeoPandas, an extension to Pandas that works with geographic data. (I know, the name doesn't make that much of a mystery.)
The geographic information space has a huge number of standards, including file formats. Fortunately, GeoPandas can work with a number of the more popular formats, including "shapefiles," which are the format used by the Clockwork Micro data set at https://github.com/clockworkmicro/parisolympics2024.
I first downloaded the data set onto my computer. I then loaded GeoPandas and asked it to read the shapefile (ending with .shx) into a GeoDataFrame, the geographically aware version of a data frame:
import geopandas

gdf = geopandas.read_file('parisolympics2024/shapefile/torchrelaylines.shx')
After loading the file, I ran gdf.dtypes to see what kind of data we had:
step           float64
date            object
region          object
state_town      object
geometry      geometry
dtype: object
As you can see, we mostly have run-of-the-mill Pandas dtypes – float64 and object (i.e., strings). But then we have a column named geometry which is of type geometry. That's where GeoPandas does its magic; that column holds geographical data.
Note that the column is called geometry, but doesn't have to be; you can call it anything you want. (But its dtype will always be geometry.) A GeoDataFrame can contain more than one column with a geometry dtype, but if that's true, one is set to be the primary geometric information. In such a case, you can run GeoPandas methods on the GeoDataFrame, and you'll get results from the specified geometry column (which again, can be called anything you like). You can set that column with the set_geometry method, which functions much like set_index does in Pandas.
The geometry column in our data frame can contain any number of values from the Shapely package, which defines Python objects for use in geographical systems. These can be points, line strings, or polygons, or collections of any of these. So in our case, when I asked to see gdf['geometry'], I got this:
0           LINESTRING (5.37 43.2964, 5.37 43.2964)
1           LINESTRING (5.37 43.2964, 5.37 43.2964)
2       LINESTRING (5.37 43.2964, 5.93056 43.12583)
3     LINESTRING (5.93056 43.12583, 5.7839 43.8342)
4       LINESTRING (5.7839 43.8342, 4.6278 43.6767)
                          ...
63    LINESTRING (2.4296 48.6238, 2.13012 48.80141)
64    LINESTRING (2.13012 48.80141, 2.1969 48.8988)
65      LINESTRING (2.1969 48.8988, 2.3967 48.9322)
66    LINESTRING (2.3967 48.9322, 2.34901 48.86472)
67                                             None
Name: geometry, Length: 68, dtype: geometry
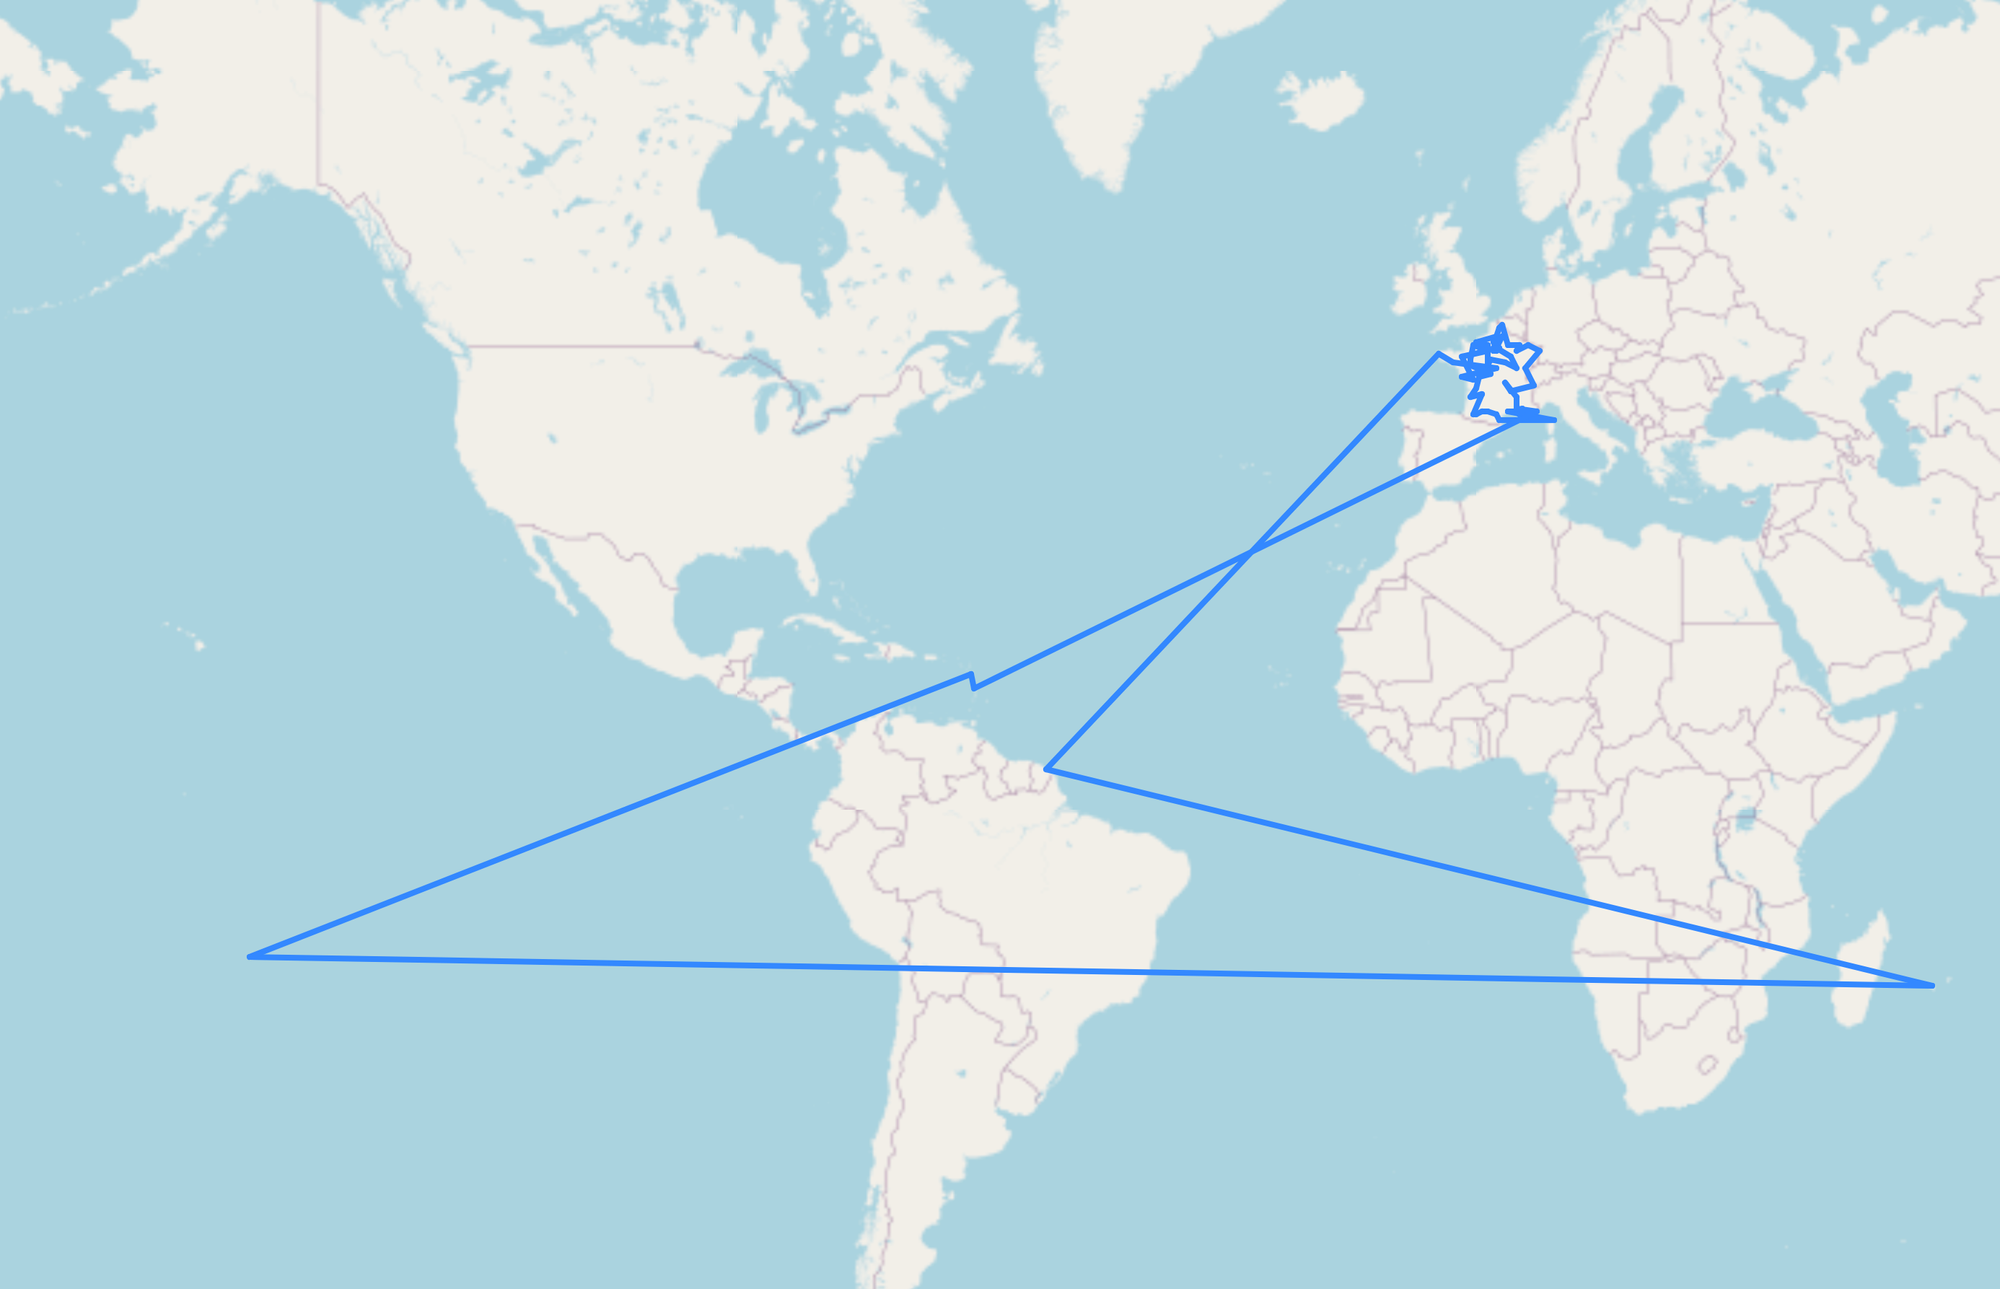
As you can see, we have a LINESTRING type, meaning a line made up of one or more line segments. To display the geometry column on a map – an interactive map, inside of Jupyter no less – we can just invoke the explore method:
a
(
    gdf
    .explore()
)
Invoking the above inside of Jupyter will pop up an interactive, scrollable world map with the linestrings displayed:
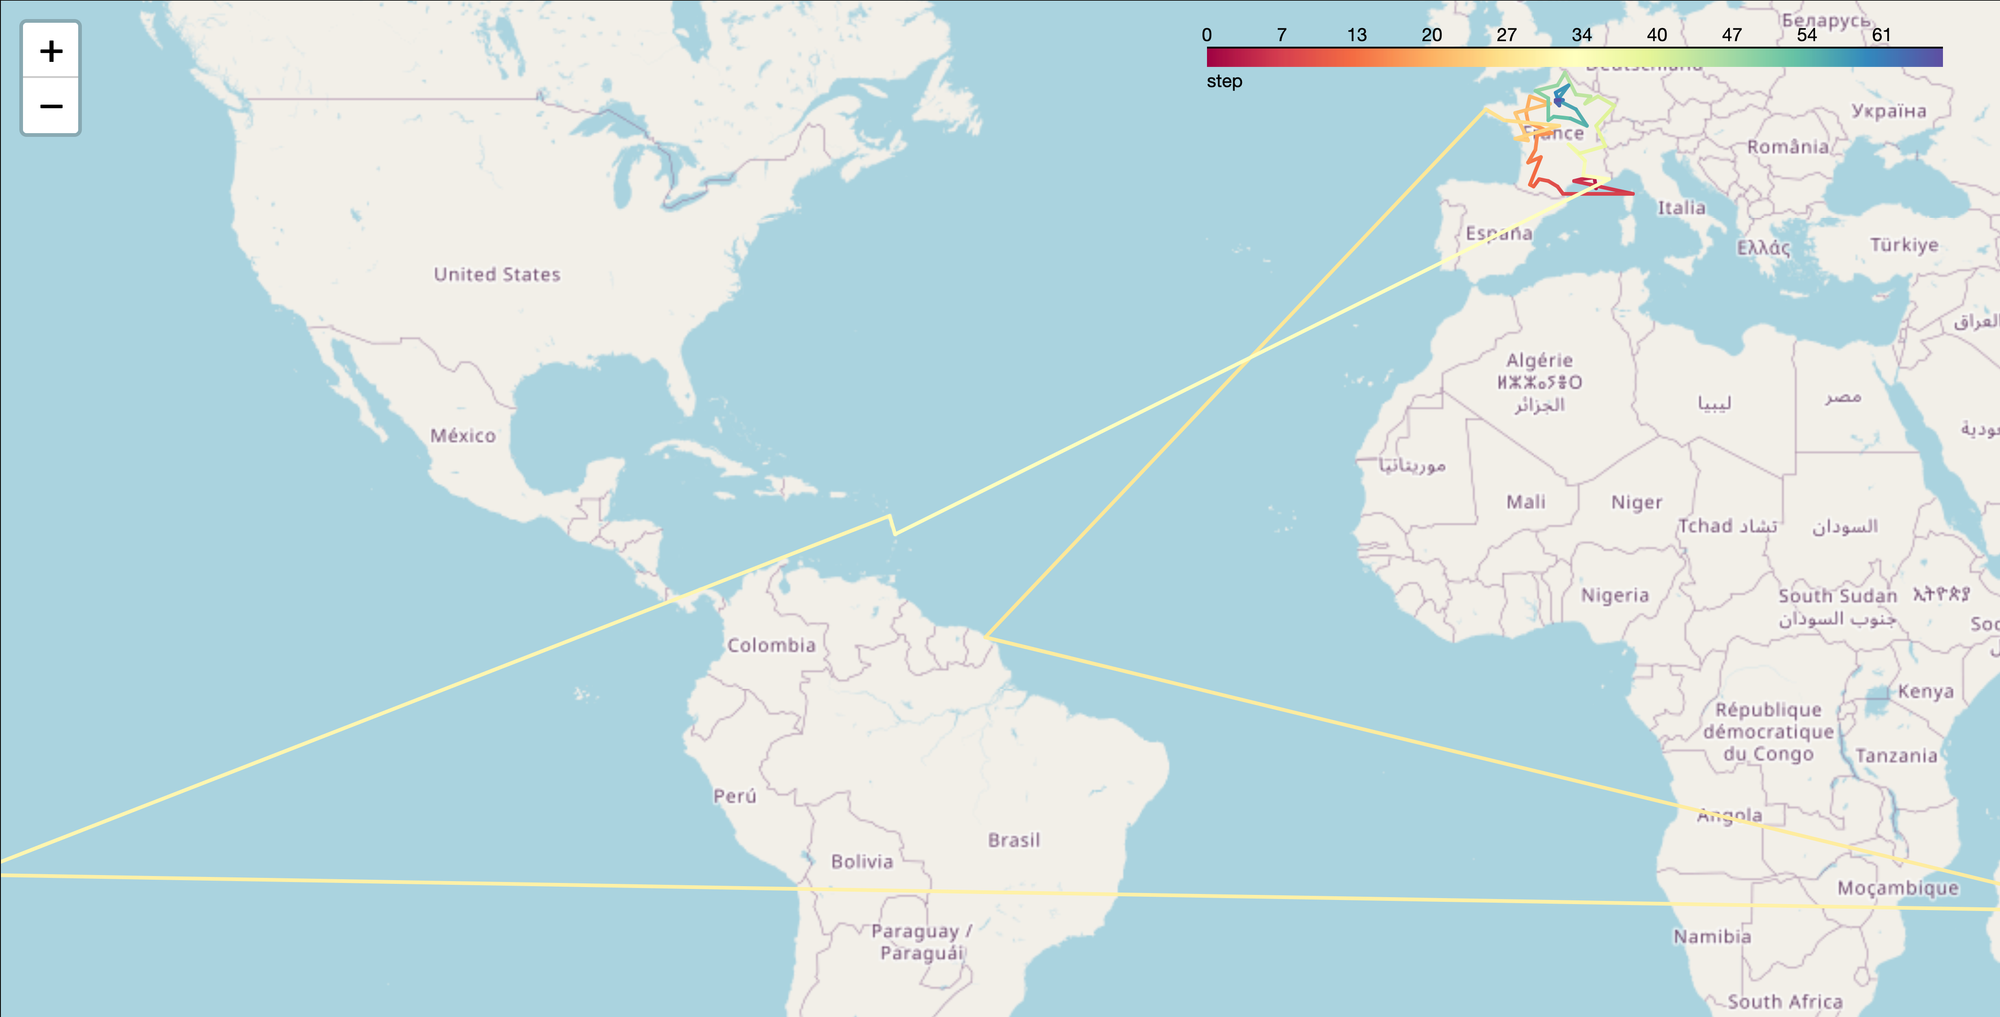
But we can do even better: We can give each line segment a color. Normally, the color would have to do with some numeric or categorical column, but we can just ask GeoPandas to use the step column (i.e., which step of the torch's run we're on) and to use the Spectral colormap, which goes from red to violet:
(
    gdf
    .explore('step', cmap='Spectral')
)
Here's how that looks:
Which three segments of the torch route, in which state and town, were the longest?
On the face of it, this should be easy:
- We have the
geometrycolumn, withlinestringdata. - GeoPandas has a
distancemethod, which calculates the total distance of ageometrycolumn. - We can make that calculation for each row, and then sort the rows by the total distance
- We can then find the three longest segments
Let's start by using assign to calculate the length and assign it to a new column, on which we'll be able to sort:
(
    gdf
    .set_index('state_town')
    .assign(length = lambda df_: df_['geometry'].length)
)
This looks pretty good: We set the index to be state_town, and then create the new length column, retrieving the length property. But when we try it, we get an ominous warning:
/var/folders/rr/0mnyyv811fs5vyp22gf4fxk00000gn/T/ipykernel_12451/1028876933.py:7: UserWarning: Geometry is in a geographic CRS. Results from 'length' are likely incorrect. Use 'GeoSeries.to_crs()' to re-project geometries to a projected CRS before this operation.

  .assign(length = lambda df_: df_['geometry'].length)
What's going on? It turns out that geographical information is always stored in a CRS (coordinate reference system). In the simplest sense, the CRS indicates where the (0,0) point is, in what direction each axis goes, and what measurements we're using. But there are two basic types of CRS, a coordinate system or a projected coordinate system.
In this particular case, the CRS used by our geographic data is EPSG:4326. EPSG is the European Petroleum Survey Group, which established a number of these standards and still seems to be naming/designating them. And EPSG:4326 is a very common coordinate system, using longitude and latitude.
That sounds great, and it is - until you actually want to measure distances. For that to work, you need to project the coordinates onto a 2D map. Such projected coordinate systems are always a bit wrong, as you would expect when you try to make a 3D object appear in 2D, and especially when you take the Earth and try to turn parts of it into a 2D map. Because there are different approaches and ways to do this, there are many different projected coordinate systems.
A common one is EPSG:3857, the "Web Mercator projection." It works kind of how you expect a map or globe to work, with 0 being at the Prime Meridian and Equator, and measured in meters. If we can convert our GeoDataFrame to EPSG:3857, then everything will work.
And sure enough, we can do that with the to_crs method:
(
    gdf
    .set_index('state_town')
    .to_crs(epsg=3857)
    .assign(length = lambda df_: df_['geometry'].length)
)
Now that we have the length column calculated, we can sort by it and get the three highest values:
(
    gdf
    .set_index('state_town')
    .to_crs(epsg=3857)
    .assign(length = lambda df_: df_['geometry'].length)
    .sort_values('length', ascending=False)
    .head(3)
)
Here's what I got, when asking only for the step, date, and length columns:
                                 step       date        length
state_town
Papeete (Polynésie française)  30.0  13/6/2024  2.282587e+07
Saint-Denis (La Réunion)        29.0  12/6/2024  1.235046e+07
Baie-Mahault (Guadeloupe)        31.0  15/6/2024  1.051321e+07
And that's it!
Here's the Jupyter notebook I used to solve these problems:
I'll be back next week with more Pandas puzzles.
Reuven