


President Trump recently issued an executive order telling the US government's executive branch to rename Lake Ontario to Lake America. This was done as punishment for Canada refusing to give into Trump's demands from Canada in the current trade war — although it's not entirely clear who is being punished here.
Of course, names have long been political. What you call a country, a city, or even a street can depend on who is running your part of the world. (Just ask the residents of North Macedonia.) The New York Times had a story today about some of the bigger debates regarding what certain geographical features are called: https://www.nytimes.com/2026/09/03/world/americas/lake-ontario-bodies-of-water-naming-disputes-south-china-sea.html?unlocked_article_code=1.-VA.XPsh.DTbJbeJROkep&smid=url-share
And if you didn't read it yesterday, then I highly recommend Alexandra Petri's satirical column in the Atlantic: https://www.theatlantic.com/newsletters/2026/08/everything-called-america-now/688443/?gift=oY9TCwcAO4lary6E0C-eKedgwRiiT0yXIJ1k8taeoFE&utm_source=copy-link&utm_medium=social&utm_campaign=share.
This week, we looked at data from the U.S. Board on Geographic Names (BGN), which maintains the official database of names for the United States. The data set we're looking at doesn't have a full history of each name, and when it was changed, although that is apparently available. We can, however, find out when each name was most recently changed, what it was changed to, and who made that decision. And along the way, we'll have fun exploring the data with Pandas.
Data and six questions
The data itself comes in the form of two zipfiles, each containing a large CSV file (along with some other information):
- The main data, with names: https://prd-tnm.s3.amazonaws.com/StagedProducts/GeographicNames/DomesticNames/DomesticNames_National_Text.zip
- Historical data (i.e., the history of the location, not of changes): https://prd-tnm.s3.amazonaws.com/StagedProducts/GeographicNames/Topical/FeatureDescriptionHistory_National_Text.zip
The data dictionary, if you're interested in learning more about this data set, is also downloadable from AWS, at https://prd-tnm.s3.amazonaws.com/StagedProducts/GeographicNames/GNIS_file_format.pdf.
Paid subscribers, both to Bamboo Weekly and to my LernerPython+data membership program (https://LernerPython.com) get all of the questions and answers, as well as downloadable data files, downloadable versions of my notebooks, one-click access to my notebooks, and invitations to monthly office hours.
Learning goals for this week include working with CSV files, dates and times, joins, grouping, and plotting.
Here are my six questions and tasks for this week, along with my solutions and explanations:
Read the main name data into a Pandas data frame, making sure that the date columns are all handled as dates. Where we have information about the authority under which information was updated or changed, how many were done under each authority? How many updates have been made by executive order, and when were those made? How many lakes in the United States have the name "America" in them?
I started by loading Pandas and Plotly:
import pandas as pd
from plotly import express as px
I then wanted to load the first file (which I had zipped, given that it's a huge CSV file) into a data frame using read_csv. However, a quick look at the file showed me that the separator used was a vertical bar (|). Also, given how large the file was, I decided to use the pyarrow CSV-loading engine, which is typically much faster than the regular Pandas engine:
names_filename = 'data/bw-186-DomesticNames_National.zip'

names_df = pd.read_csv(names_filename, sep='|', engine='pyarrow')
This worked, but there was still one problem: The date-related columns still had string dtypes. Usually, I've found that PyArrow is smart enough to identify date columns and turn them into datetime dtypes, but here it didn't. I thus passed the parse_dates keyword argument, indicating which three columns should be turned into datetime values:
names_filename = 'data/bw-186-DomesticNames_National.zip'

names_df = pd.read_csv(names_filename, sep='|', engine='pyarrow',
                parse_dates=['date_created', 'date_edited', 'bgn_date'])
Sure enough, I ended up with a data set containing 981,706 rows and 21 columns, for a total of about 60 MB of memory. (This is significantly less than the memory it would have taken in Pandas 2, using Python strings.)
The bgn_authority column tells us which authority told BGN to update its records. We can find out how many records were updated by each authority with value_counts:
names_df['bgn_authority'].value_counts()The result:
bgn_authority	count
Board Decision	57801
Secretarial Order	613
Congressional Legislation	81
Executive Order	4
It would seem that the overwhelming majority of decisions (at least, for which we have data) were done by a "Board decision," which means the BGN itself. But we can see that there are a handful made in other ways, including by order of the secretary (presumably the Secretary of the Interior), congressional legislation, or the technique that brought us this week's topic, an executive order.
We know that four name updates were done by executive order, but which were they? We can find out with another query, first using the 2-argument version of loc and pd.col to find matching rows, then keeping only a handful of columns
(
    names_df
    .loc[pd.col('bgn_authority') == 'Executive Order',
        ['feature_name', 'feature_class', 'state_name', 'county_name', 'date_edited']]
)
The results:
	feature_name	feature_class	state_name	county_name	date_edited
113827	Molok Luyuk	Ridge	California	Lake	2024-05-08
275526	Gulf of America	Sea	Louisiana	Lafourche	2025-02-09
480879	Lake America	Lake	New York	Cayuga	2026-08-27
703972	Mount McKinley	Summit	Alaska	Denali	2025-02-15
In other words, three of the four executive orders involved with renaming locations were done under President Trump. The fourth, done in May of 2024, was performed by President Biden.
So basically, no location's name was changed by executive order until just a few years ago. Or so you might be led to believe – but that isn't true! For example, President Johnson renamed Cape Canaveral in Florida to "Cape Kennedy" by executive order. But then the Florida legislature changed it back in 1973. This data set only shows the most recent name designation. So only four locations got their current names by executive order.
Finally, I was curious to know how many lakes have the word "America" in them. I would think, after all, that it would be a pretty common name. My query used loc and pd.col again, but also str.contains to look anywhere inside of the string (rather than check for equality):
(
    names_df
    .loc[pd.col('feature_class') == 'Lake']
    .loc[pd.col('feature_name').str.contains('America'),
        ['feature_name', 'feature_class', 'state_name', 'county_name']]
)
It turns out that there are 17 such lakes:
	feature_name	feature_class	state_name	county_name
76699	American Lake	Lake	Colorado	Pitkin
82574	American Lake	Lake	Colorado	Hinsdale
114591	Young America Lake	Lake	California	Sierra
123313	Lake South America	Lake	California	Tulare
125267	American Lake	Lake	California	El Dorado
157340	American Legion Lake	Lake	Georgia	Meriwether
204955	American Hill Lake	Lake	Idaho	Idaho
338849	Young America Lake	Lake	Minnesota	Carver
343568	American Lake	Lake	Minnesota	St. Louis
355996	American Legion Lake	Lake	Mississippi	Perry
455001	Laguna Americana	Lake	New Mexico	Cibola
480879	Lake America	Lake	New York	Cayuga
619237	America Lake	Lake	South Dakota	Brule
738176	South American Pond	Lake	Vermont	Essex
761201	American Lake	Lake	Washington	Pierce
769624	American Lake	Lake	Washington	Yakima
798299	American Lake	Lake	Wisconsin	Iron
The most famous Lake America has an index or 480879, and is listed in the database as being in Cayuga county, New York. But there are plenty of "American Lakes" in a variety of places.
Create a bar plot showing the number of changes to this database that were made in each year. Any thoughts about particular years? Take the largest year and count records by exact date — what does that tell you about how the database is maintained?
I'll admit that my phrasing of this question doesn't precisely reflect the data set, which tells us when each record was last updated. So we can't know from the data how many times a year the data was updated. But we can know how many records were modified in a given year.
I started by using assign to add a new column, year, retrieving dt.year from the date_edited column. I then got rid of any row that had NaN in the year column, using dropna with the subset keyword argument:
(
    names_df
    .assign(year = pd.col('date_edited').dt.year)
    .dropna(subset='year')
)
Then, with the remaining (clean) data, I invoked groupby , using the year column as my categorical, and counting the number of rows using feature_id. (I initially made the mistake of using sum. Fortunately, adding up the row IDs gives such huge numbers that the mistake became obvious fairly quickly.)
Following the groupby, I then used pipe to run the resulting series to px.bar, giving us a bar plot:
(
    names_df
    .assign(year = pd.col('date_edited').dt.year)
    .dropna(subset='year')
    .groupby('year')['feature_id'].count()
    .pipe(px.bar)
)
The result:
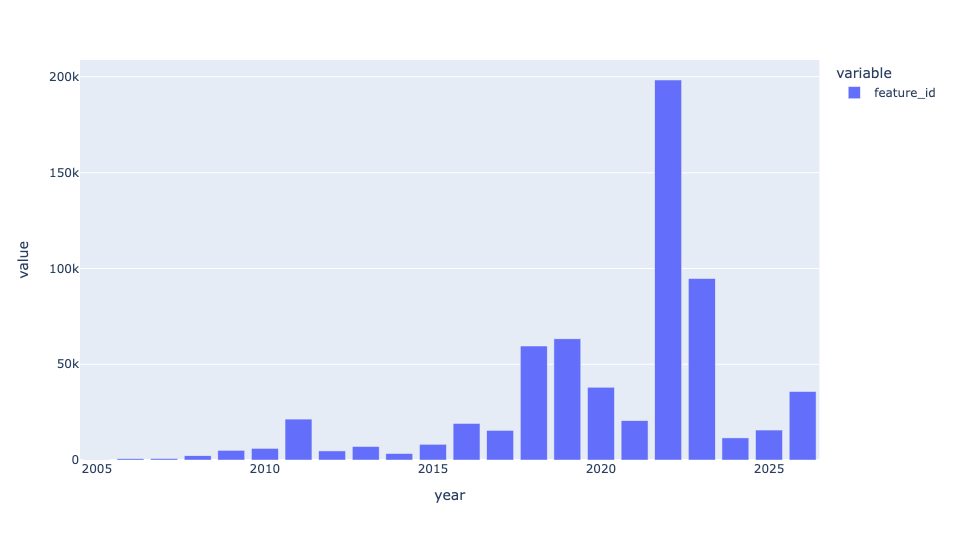
According to this plot, nearly 200,000 records were updated in 2022. What was going on then? I decided to check and see if the updates were concentrated on a particular day:
(
    names_df
    .loc[pd.col('date_edited').dt.year == 2022]
    ['date_edited']
    .value_counts()
    .head(10)
)
Sure enough:
date_edited	count
2022-06-07	173840
2022-08-31	2534
2022-08-30	2389
2022-05-31	2332
2022-09-01	1966
2022-09-07	1102
2022-07-16	758
2022-08-29	651
2022-09-08	562
2022-09-02	485
So more than 173,000 records were updated on June 7th, 2022. We could dive into whether these records all came from a particular place or a particular government directive, but it's clear that there was, on a single day, a massive update of this database — larger than any other full year in which the database was updated.