


This week, we looked at refugees – how many there are, where they come from, and where they go. This was inspired by a conversation I had with a taxi driver on my way to the Prague airport, who expressed mostly positive feelings about what the Czech Republic had done for Ukrainian refugees.
Data and seven questions
This week's data comes from three files, all produced by the World Bank:
- The population of each country and area, per year: https://api.worldbank.org/v2/en/indicator/SP.POP.TOTL?downloadformat=csv
- The number of refugees who left each country and area, per year: https://api.worldbank.org/v2/en/indicator/SM.POP.REFG.OR?downloadformat=csv
- The number of refugees who left each country and area, per year: https://api.worldbank.org/v2/en/indicator/SM.POP.REFG?downloadformat=csv
Here are this week's seven challenges and questions. As always, a link to the Jupyter notebook I used to solve these problems is at the end of this post.
Create a single data frame whose index is made up of country names. The columns will be a multi-index with top-level names "origin", "destination", and "population". The lower level of the multi-index should contain the years; you can remove other columns.
Let's start by loading Pandas:
import pandas as pd
With that in place, we'll first need to load each of the three CSV files into a data frame. We can start with the refugee origin file, using read_csv:
refugee_origin_filename = 'API_SM.POP.REFG.OR_DS2_en_csv_v2_1058274.csv'

refugee_origin_df = (
    pd
    .read_csv(refugee_origin_filename
)
However, there are several problems with loading the CSV file in this way. First of all, the file has several comment lines at the top, which we want to ignore; the column headers are on line 2. We can thus pass header=2, which tells read_csv to start on line 2. We'll also ask for the Country Name column to be used as the index:
refugee_origin_df = (
    pd
    .read_csv(refugee_origin_filename,
              header=2,
              index_col='Country Name')
)
This is good, but we only want the columns containing the years. We can tell Pandas to keep only those columns whose names consist of four digits with the filter method, passing a regular expression via the regex keyword argument and specifying that we're looking at the column names via axis='columns':
refugee_origin_df = (
    pd
    .read_csv(refugee_origin_filename,
              header=2,
              index_col='Country Name')
              .filter(regex=r'^\d+$', axis='columns')
)
The above regular expression can be read as:
- We want to anchor our match to the start of the string with
^ - We're looking for one or more decimal digits with
\d+ - We want to anchor our match to the end of the string with
$
In other words, we're looking for column names that contain only digits. We could probably have tightened it up by saying \d{4}, for four digits, but this is good enough for our purposes.
But wait: If all of the columns are four-digit strings representing years, we can change them to be integers. If we want, we could run astype(int) on refugee_origin_df.columns, getting back integers, and then assign the result back to refugee_origin_df.columns:
refugee_origin_df.columns = refugee_origin_df.columns.astype(int)But it feels weird to use assignment when we've managed to do the rest via method chaining. But how can we assign to our data frame's columns from within a method chain?
It's possible with the pipe method, which lets us run a function on our data frame, getting a chained result. And the function we'll run? It'll be a lambda, taking the data frame that we've gotten so far via the method chain, running set_axis to assign to our columns:
refugee_origin_df = (
    pd
    .read_csv(refugee_origin_filename,
              header=2,
              index_col='Country Name')
              .filter(regex=r'^\d+$', axis='columns')
              .pipe(lambda df_: df_.set_axis(df_.columns.astype(int), axis='columns'))
)
The result? refugee_origin_df now contains one row per country (plus some other areas, which we'll deal with in a bit), and one column per year.
We can perform the same operations on the refugee-destination and population CSV files:
refugee_destination_filename = 'API_SM.POP.REFG_DS2_en_csv_v2_1061114.csv'
population_filename = 'API_SP.POP.TOTL_DS2_en_csv_v2_1114030.csv'

refugee_destination_df = (
    pd
    .read_csv(refugee_destination_filename,
              header=2,
              index_col='Country Name')
        .filter(regex=r'^\d+$', axis='columns')
        .pipe(lambda df_: df_.set_axis(df_.columns.astype(int), axis='columns'))
)

population_df = (
    pd
    .read_csv(population_filename,
              header=2,
              index_col='Country Name')
    .filter(regex=r'^\d+$', axis='columns')
    .pipe(lambda df_: df_.set_axis(df_.columns.astype(int), axis='columns'))
)
We now have three data frames, all of which have the same index and columns. But we want to join them together into one big data frame. How can we do that?
Normally, we would use pd.concat to combine multiple data frames into a single, new one. But I asked you to do something a bit different, combining them but using a multi-index for the columns, such that we can keep track of the data's original frames.
Fortunately, we can pass pd.concat an additional keys keyword argument, indicating the multi-index name we want to associate with each of the original data frames:
df = pd.concat([population_df, refugee_destination_df, refugee_origin_df],
              axis='columns',
              keys=['population', 'destination', 'origin'])
The result is a data frame with 266 rows (for countries) and 192 columns (64 years for each original data frame).
Now, the rows still contain more than just countries – but we'll deal with weeding out the non-country names in the next answer.
What 10 countries accepted the most refugees in 2000 and 2023?
In 2000, where did refugees go? We can get this information by querying our data frame, retrieving only the column under destination and 2000. We can do this by passing a tuple inside of square brackets:
(
    df
    [('destination', 2000)]
    .nlargest()
)
In general, when you're trying to drill down through a multi-index, you can use a tuple, with one element per level of the multi-index. However, we still need to find the destinations with the greatest numbers in 2000. This requires using nlargest:
(
    df
    [('destination', 2000)]
    .nlargest()
)
The good news is that this works. The bad news is that the results we get seem a bit weird:
Country Name
World                         15935134.0
Low & middle income           13376149.0
IDA & IBRD total              12001044.0
Middle income                 11490188.0
Early-demographic dividend     8438167.0
Name: (destination, 2000), dtype: float64
As you can see, our data frame contains rows not just for individual countries, but for groups of countries, too. Which means that if we want to find countries, we'll need to remove any of those groups.
How? It took me a while, to be honest, using a regular expression to describe the country names (and partial names) I wanted to ignore. My regular expression basically looked for anything with a bunch of words or phrases, which I put into the variable ignore_pattern. I then got the data frame's index and turned it into a series with to_series, which returned a series whose index and values were identical. I then used loc to keep only those elements that did not match my regexp pattern, using str.contains.
ignore_pattern = r'(?:countries|situations|IDA|IBRD|demographic|OECD|World|Middle East|Sub-Saharan|ern and|Euro|income|Asia|America\b)'

countries = (df
             .index
             .to_series()
             .loc[lambda s_: ~s_.str.contains(ignore_pattern,
                                              regex=True)]
            )
I can now use loc and the countries series to keep only those rows from df for actual countries. I do that, adding the loc into the query:
(
    df
    .loc[lambda df_: df_.index.isin(countries)]
    [('destination', 2000)]
    .nlargest()
)
And now I get much more reasonable results:
Country Name
Pakistan              2001460.0
Iran, Islamic Rep.    1868000.0
Jordan                1610630.0
West Bank and Gaza    1428891.0
Germany                906000.0
Name: (destination, 2000), dtype: float64
So back in 2000, the greatest number of refugees were going to Pakistan, Iran, and Jordan. (Not what I expected or remembered!)
How about in 2023? Here's the (almost identical) query:
(
    df
    .loc[lambda df_: df_.index.isin(countries)]
    [('destination', 2023)]
    .nlargest()
)
The results:
Country Name
Iran, Islamic Rep.    3764517.0
Turkiye               3251127.0
Jordan                3063591.0
Germany               2593007.0
West Bank and Gaza    2482144.0
Name: (destination, 2023), dtype: float64
The numbers, as you can see, are far higher than they were 23 years earlier.
Which 10 countries were the origin of most refugees from 2000 through 2023?
Now that we've looked at where refugees were going to, let's look at where they came from. And rather than look at one or two years, let's look at a whole range of years.
We're going to want to keep only the rows that match our countries series, so that'll be what we pass the row selector – i.e., the first argument to loc. But the harder part will be the column selector. How can we retrieve the columns for all of the rows 2000-2023, but only under the "origin" part of the multi-index?
The answer: Use a pd.IndexSlice object, which lets us use a slice for each layer of a multi-index:
(
    df
    .loc[countries,
        pd.IndexSlice['origin', range(2000, 2024)]]
)
The above retrieves from the "origin" outer part of the multi-index, and everything from 2000 through 2023. (Remember that range , like so many other things in Python, is always "up to and not including.)
Now that we have all of the "origin" columns from 2000 through 2023, we can use sum to sum them across the columns, getting a total per country. We can then use nlargest to find the 10 countries that produced the most refugees:
(
    df
    .loc[countries,
        pd.IndexSlice['origin', range(2000, 2024)]]
    .sum(axis='columns')
    .nlargest(10)
)
The results:
Country Name
Afghanistan             71540799.0
Syrian Arab Republic    63715783.0
South Sudan             19132212.0
Somalia                 18099073.0
Iraq                    17445198.0
Sudan                   15670292.0
Congo, Dem. Rep.        13504371.0
Ukraine                 13420734.0
Myanmar                 13234545.0
Eritrea                  8128223.0
dtype: float64
So Afghanistan produced 71 million refugees, and Syria produced 63 million refugees during these years, right? Hmm, wait a second – given that Afghanistan has a population of about 40 million people, and Syria has a population of about 22 million, that seems a bit ... suspicious.
It would seem that the data doesn't describe how many new refugees there were each year. Rather, it shows the cumulative number of refugees from a place in a given year. Each year's figure includes the previous year's figure.
To find the number of refugees that a country produced between 2000 and 2023, we need to find the difference between the 2023 column and the 2000 column. I decided to do this with diff, passing theperiods keyword argument a value of 23, so that we subtract the first column from the last one:
(
    df
    .loc[countries,
        pd.IndexSlice['origin', range(2000, 2024)]]
    .diff(periods=23, axis='columns')
)
With that in place, we can now grab just the origin column for 2023, and then invoke nlargest:
(
    df
    .loc[countries,
        pd.IndexSlice['origin', range(2000, 2024)]]
    .diff(periods=23, axis='columns')
    [('origin', 2023)]
    .nlargest(10)
)
The result:
Country Name
Syrian Arab Republic        6349920.0
Ukraine                     5941052.0
Afghanistan                 2815817.0
Myanmar                     1146305.0
Sudan                       1002572.0
Central African Republic     759052.0
Congo, Dem. Rep.             606504.0
Nigeria                      404573.0
Somalia                      366400.0
Venezuela, RB                347226.0
Name: (origin, 2023), dtype: float64
We see that Syria was in first place, with 6.3 million refugees between 2000 and 2023. Ukraine came second, with 5.9 million refugees, and then Afghanistan, Myanmar, and Sudan rounded out the top five.
What countries accepted the most refugees in 2000 and 2023 as a percentage of their population?
My conversation with my taxi driver in Prague got me thinking: Countries in Europe have been absorbing a huge number of refugees, especially relative to their native population. Which have absorbed the greatest percentage? Let's compare 2000 and 2023.
First, we'll grab only the rows with country names, and then we'll use pd.IndexSlice to grab multiple values from our column multi-index – in this case, both destination and population, and the years 2000 and 2023. Then, we'll use fillna to replace NaN values with 0:
(
    df
    .loc[countries,
        pd.IndexSlice[['destination', 'population'], [2000, 2023]]]
    .fillna(0)
)
Next, we'll use stack to move the inner part of the column multi-index to the rows, leaving us with just two columns, destination and population. Note that the behavior of stack will be changing soon, so we pass future_stack=True to quiet the warning (which doesn't seem to affect this data set):
(
    df
    .loc[countries,
        pd.IndexSlice[['destination', 'population'], [2000, 2023]]]
    .fillna(0)
    .stack(future_stack=True)
)
Now we'll use assign to create a new column, pct_refugees, dividing destination by population. We can then grab just that new column, use xs to retrieve only those rows in which the inner multi-index is 2000, and invoke nlargest(10) to get the 10 greatest percentages:
(
    df
    .loc[countries,
        pd.IndexSlice[['destination', 'population'], [2000, 2023]]]
    .fillna(0)
    .stack(future_stack=True)
    .assign(pct_refugees = lambda df_: df_['destination'] / df_['population'])
    ['pct_refugees']
    .xs(2000, level=1)
    .nlargest(10)
)
The result:
Country Name
West Bank and Gaza    0.488986
Jordan                0.318547
Lebanon               0.088585
Armenia               0.088554
Serbia                0.064445
Guinea                0.051243
Congo, Rep.           0.039307
Djibouti              0.031317
Iran, Islamic Rep.    0.028500
Zambia                0.025370
Name: pct_refugees, dtype: float64
Performing the same query on the 2023 data has these results:
Country Name
West Bank and Gaza    0.480498
Jordan                0.270228
Lebanon               0.238910
Montenegro            0.105056
Chad                  0.060230
Armenia               0.054025
Moldova               0.048634
Iran, Islamic Rep.    0.042216
Turkiye               0.038102
Czechia               0.034682
Name: pct_refugees, dtype: float64
We see that in both 2000 and 2023, nearly half of the residents of the West Bank and Gaza are considered refugees – a point that is considered rather controversial in Israel, where I live, given that this status has been been since 1948 (Israel's establishment) and 1967 (the Six-Day War). I'm going to guess that the dramatic rise in the percentage of refugees in Lebanon from 2000 to 2023 – 8 percent to 24 percent – stems from Syria's civil war.
In 10th place of 2023, we can see Czechia (aka the Czech Republic), where 3.5 percent of their population is now refugees, presumably most of them coming from Ukraine.
What was the total number of refugees (as per the "origin" data) per decade?
Our data is per year – but to answer this question, we'll need data per decade. To be honest, I originally thought (as I indicated above) that the data set showed how many new refugees there were per year. Which meant that we would have to use resample in order to calculate the number of refugees per decade. Doing this showed a truly ridiculous number of refugees accumulating.
Once I realized that the data represented the cumulative total, I realized that we could do this a different way, namely by selecting every 10 years, then summing them up:
(
    df
    .loc[lambda df_: df_.index.isin(countries), 'origin']
    [range(1960, 2024, 10)]
    .sum()
)
I decided to add 2023 to the mix, to see how much the refugee crisis had grown in the last few years, since the war in Ukraine started:
(
    df
    .loc[lambda df_: df_.index.isin(countries), 'origin']
    [list(range(1960, 2024, 10)) + [2023]]
    .sum()
)
The result:
1960      150000.0
1970     1109800.0
1980     6806759.0
1990    14620172.0
2000    11285871.0
2010    10401836.0
2020    20325014.0
2023    31332128.0
dtype: float64
Wow – between 2020 and 2023, the number of refugees grew by 11 million people. And in the decade between 2010 and 2020, it grew by about 10 million people. That's 20 million new refugees in just the last 13 years.
What countries have produced, over the entire data set, the greatest total number of refugees? Which have absorbed the most?
Once again, I went into this thinking that each column represented the number of new refugees. But when I looked at my calculations, I saw that this was plain ol' wrong, that each column shows the total number until that point. Which means that to find out the total number of refugees, we just need to look at the 2023 column:
(
    df
    .loc[lambda df_: df_.index.isin(countries), 'origin']
    [2023]
    .nlargest(10)
)
And here's what we see:
Country Name
Afghanistan                 6403144.0
Syrian Arab Republic        6355788.0
Ukraine                     5960362.0
South Sudan                 2292482.0
Sudan                       1496923.0
Myanmar                     1283426.0
Congo, Dem. Rep.             978209.0
Somalia                      842044.0
Central African Republic     759187.0
Eritrea                      559853.0
Name: 2023, dtype: float64
If you've been following the news over the last decade, it won't surprise you to find that Afghanistan, Syria, Ukraine, South Sudan, and Sudan lead the pack in the number of refugees who have come from there.
As for which countries have absorbed the most, we need to grab the "destination" column for 2023:
(
    df
    .loc[lambda df_: df_.index.isin(countries), 'destination']
    [2023]
    .nlargest(10)
)
And the results:
Country Name
Iran, Islamic Rep.    3764517.0
Turkiye               3251127.0
Jordan                3063591.0
Germany               2593007.0
West Bank and Gaza    2482144.0
Pakistan              1988231.0
Uganda                1577498.0
Lebanon               1279108.0
Russian Federation    1230131.0
Chad                  1100921.0
Name: 2023, dtype: float64
Maybe it's because I read Western news, but it never occurred to me that Iran has absorbed a large number of refugees. But then we see Turkey, Jordan, and Germany have taken in a large number, which has certainly made the news that I've read.
Make a line plot of the number of refugees who arrived in the G7 countries in each year. Which country accepted the most? Which accepted the fewest?
Finally, let's see how many refugees each G7 country has accepted. First, we'll create a list of G7 country names:
g7_countries = ['United States', 'United Kingdom',
    'Canada', 'France', 'Germany', 'Italy', 'Japan']
With that in place, we can now retrieve those rows from all "destination" columns:
(
    df
    .loc[lambda df_: df_.index.isin(g7_countries), 'destination']
)
The thing is, we'll want the plot to have a single colored line per country, and for the x axis to have the years. For that, we'll need to transpose the data frame, turning the rows into columns and vice versa. Then we can invoke plot.line:
(
    df
    .loc[lambda df_: df_.index.isin(g7_countries), 'destination']
    .T
    .plot.line()
)
The resulting plot:
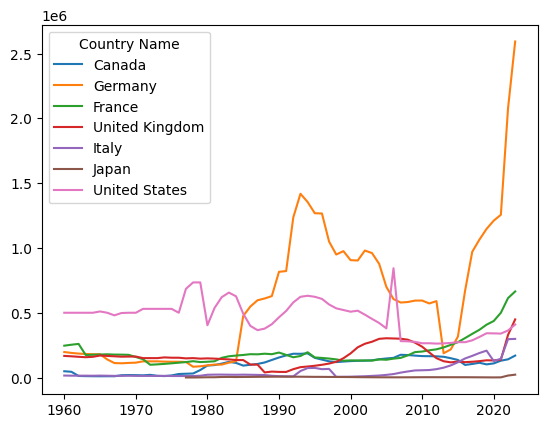
As you can see, Germany has accepted a truly huge number of refugees in the last few years, followed by France, the UK, and the US. Seeing this graph made it clear why these countries are all expressing strong anti-immigrant feelings; the numbers have increased swiftly, and we're seeing a political backlash as a result.
In any event, that's it for this week's analysis. What did you think? Did you fall into some of the same traps as I did?
Here's a link to my Jupyter notebook: https://drive.google.com/file/d/1oBB9qL1ce1HHJNi4lRUGiuM0V470KBsD/view?usp=sharing
I'll be back next week with more puzzles in data analytics for you to solve with Pandas.
Reuven