


Earlier this month, the Nobel Prizes for 2023 were awarded. This week’s topic is thus the Nobel Prize, its winners, and a variety of ways that we can analyze them. The data itself comes from the Nobel Prize foundation (https://nobelprize.org/ ).
They actually provide two types of data, both via APIs: One describes the prizes, while the other describes the laureates (i.e., the prize winners). Both APIs returned data in JSON format, which you might think would make it easy to import into Pandas. But Pandas expects to have a particular type of JSON, and we didn’t want all of the values in any event — so this week’s tasks turned out to involve both cleaning our data and then joining multiple data frames together.

Data and eight questions
This week, I gave you eight questions and tasks. Let’s go through them:
Retrieve all data about the prizes, from https://api.nobelprize.org/2.1/nobelPrizes. (Note that you'll want to specify the a high limit, to ensure that you get all of the data.) Create a data frame from what you got, with the following columns: awardYear (as an integer), category (English version), dateAwarded (turn into a DateTime), prizeAmount, prizeAmountAdjusted, laureates (it'll be a list of Python dicts), and topMotivation.
Let’s start by loading the basics we’ll need for Pandas:
import pandas as pd
from pandas import Series, DataFrame
With this in place, we can start to retrieve data from the API. In theory, we could use the read_json function to download data from a URL and then import it into a data frame. But there are two problems with this: First, it turns out that the JSON we get back from the Nobel API doesn’t work with read_json. Second, I discovered that read_json cannot read from the API! It would seem that they have some sort of browser-detection mechanism on the Nobel site that only allows particular browsers to retrieve data. (You can check the type of browser via the “user-agent” header that’s passed in an HTTP request. You can also pretend to be another kind of browser by passing a fake value for “user-agent”.)
This means that we’ll need to:
- Retrieve the data via another program or library
- Massage the data to contain the values we want
- Turn the values into a data frame
I decided to use the popular “requests” library for Python, which is a great HTTP client. I used it to retrieve content from the API:
import requests
url = 'https://api.nobelprize.org/2.1/nobelPrizes?limit=100000'
r = requests.get(url)
Notice that when retrieving from the API, I pass the “limit” keyword argument, with a value of 100,000 — far higher than the number of prizes given. If I weren’t to include this argument, I would only get information about the first 25 prizes.
The variable r now contains a “response object,” containing the content and all sorts of meta-data in it. Since the content is formatted in JSON, I could use a Python library to turn it into data structures. But why work so hard, when I can have requests do that for me?
prizes_list = r.json()['nobelPrizes']r.json() returns a dictionary with three keys. The data that interests us is a list of dicts under the “nobelPrizes” key. So I retrieved that, and put it into prizes_list.
I could actually get a data frame back by saying
DataFrame(prizes_list)But before I do that, I want to make some changes to the data. That’s partly because several of the values are themselves dictionaries, often because they are translated into several languages. I also want to make some other adjustments to the dictionaries, removing some keys and messing with others.
After some experimentation, I decided that the best way to handle this would be to use a list comprehension, passing in prizes_list and getting out a new list of dicts. The expression used in the comprehension would be a call to a function, prize_info, which would take a single dict and return a new dict based on it — with the modifications in place.
Here’s the function that I ended up writing:
def prize_info(one_entry):
    output = one_entry.copy()

    for key, value in output.items():
        if key == 'awardYear':
            output[key] = int(value)
        if isinstance(value, dict) and 'en' in value:
            output[key] = value['en']
        if key.startswith('date'):
            output[key] = pd.to_datetime(value)

    for one_key in ['links', 'categoryFullName']:
        output.pop(one_key)

    return output
This function takes a single dictionary, representing the Nobel Prize given in one category, in one year. I immediately use the dict.copy method to get a new dictionary back. I didn’t really need to do this, but I decided that it would probably be wise to modify a new dict rather than messing with the one we in the original prizes_list data structure.
I then went through every key-value pair in the dict. I turned the “awardYear” value into an integer, ensuring that I could do some math calculations on it later on.
I then looked for any value that was itself a dict, and which had “en” as a sub-key. Such cases showed that the dict contained multiple translations; I replaced the sub-dict with the English translation alone. Notice that it’s usually better to call “isinstance” rather than to run “type” on a data structure.
Finally, I converted any date value from a string into an actual datetime object using the Pandas to_datetime function.
After making these adjustments, I then iterated over several field names I wanted to remove, and used “dict.pop” to do so. You can modify a dict while iterating over it, but you cannot change its size (i.e., the number of key-value pairs). So I had to put the key-removal logic after the modification logic.
The function should be called once for each dict in the list of dicts, prize_list. We can then invoke our comprehension as follows:
new_prizes_list = [prize_info(one_entry)
                   for one_entry in prizes_list]
With our list of dicts in place, we then then create a data frame. Because we can always create a data frame from a list of dicts; the keys will be used as the column names:
prizes_df = DataFrame(new_prizes_list)This is all great, except that now we have a column (“laureates”) that contains Python dicts. We’ll deal with that in question 3.
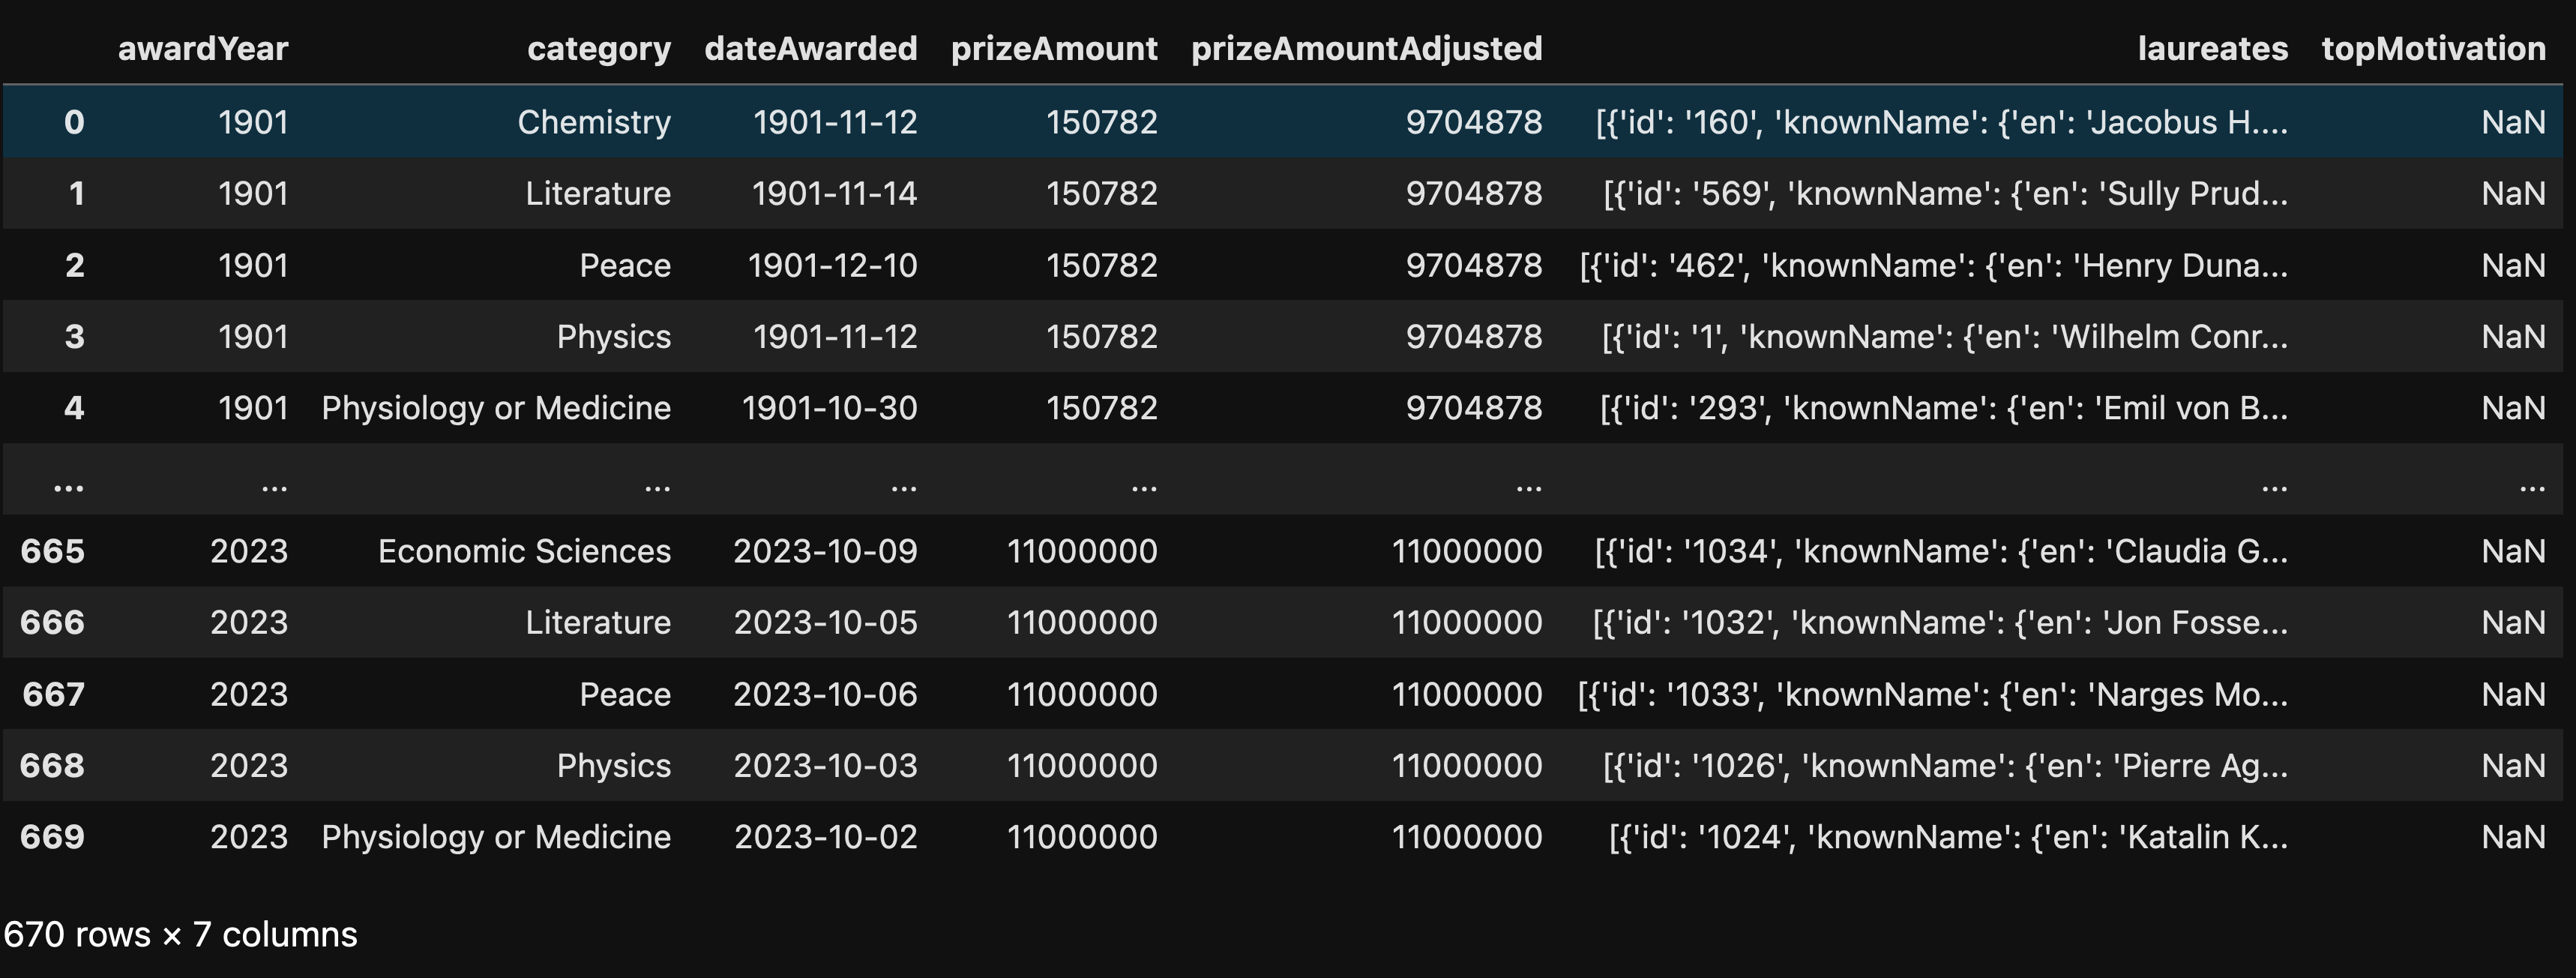
For now, we have a data frame with all of the Nobel Prizes ever given:
Retrieve all data about the laureates, from https://api.nobelprize.org/2.1/laureates. (Once again, you'll want to specify the a high limit, to ensure that you get all of the data.) Create a data frame from what you got, with the following columns: id, givenName (English), familyName (English), gender (English), birth (only the year), death (only the year), orgName (if available). Make the "id" column the index.
I did something very similar with the laureates data. First, I retrieved it using requests, getting a list of dicts for the laureates:
url = 'https://api.nobelprize.org/2.1/laureates?limit=100000'
r = requests.get(url)
laureates_list = r.json()['laureates']
As with the prizes, I passed the “limit” keyword argument, with a value of 100,000, to avoid the 25-element maximum that the API normally returns.
Next, I wrote a function that takes a single dict as input, and returns a modified dict as output:
def laureates_info(one_entry):
    output = one_entry.copy()

    for key, value in output.items():
        if isinstance(value, dict) and 'en' in value:
            output[key] = value['en']
        if key == 'birth':
            output['birth'] = int(value['date'][:4])
        if key == 'death':
            output['death'] = int(value['date'][:4])

    for one_key in ['links', 'wikipedia', 'wikidata',
                    'sameAs', 'nobelPrizes', 'founded',
                    'nativeName', 'penName', 'penNameOf',
                    'foundedCountry', 'foundedCountryNow',
                    'foundedContinent', 'knownName',
                    'fullName', 'fileName']:
        if one_key in output:
            output.pop(one_key)

    return output
The above function is very similar to the prize_info function that we saw earlier.
First, I make a copy of the input dict. Then, I go through each key-value pair, replacing any translation sub-dict with the English version.
Both “birth” and “death” were also keys with complex sub-dicts indicating where and when someone was born. I decided to just replace the values with the year of their birth and death, and turn them into integers. Notice that this works because I’m not changing the number of key-value pairs in the dict, which is OK when iterating over a dictionary. Adding or removing a column wouldn’t have been possible.
I then removed the keys that were uninteresting to me, and returned the output.
The above function works on a single dict, representing a single Nobel laureate. Given that I have a list of those laureates, I can use a list comprehension to run the function on each element of the list, and pass the resulting list of dicts to DataFrame:
new_laureates_list = [laureates_info(one_entry)
                   for one_entry in laureates_list]
laureates_df = DataFrame(new_laureates_list).set_index('id')
Notice that after calling DataFrame on the list of dicts, I get back a data frame. Before returning and assigning it to laureates_df, I invoke “set_index”, ensuring that the “id” column will be the index for the data frame.
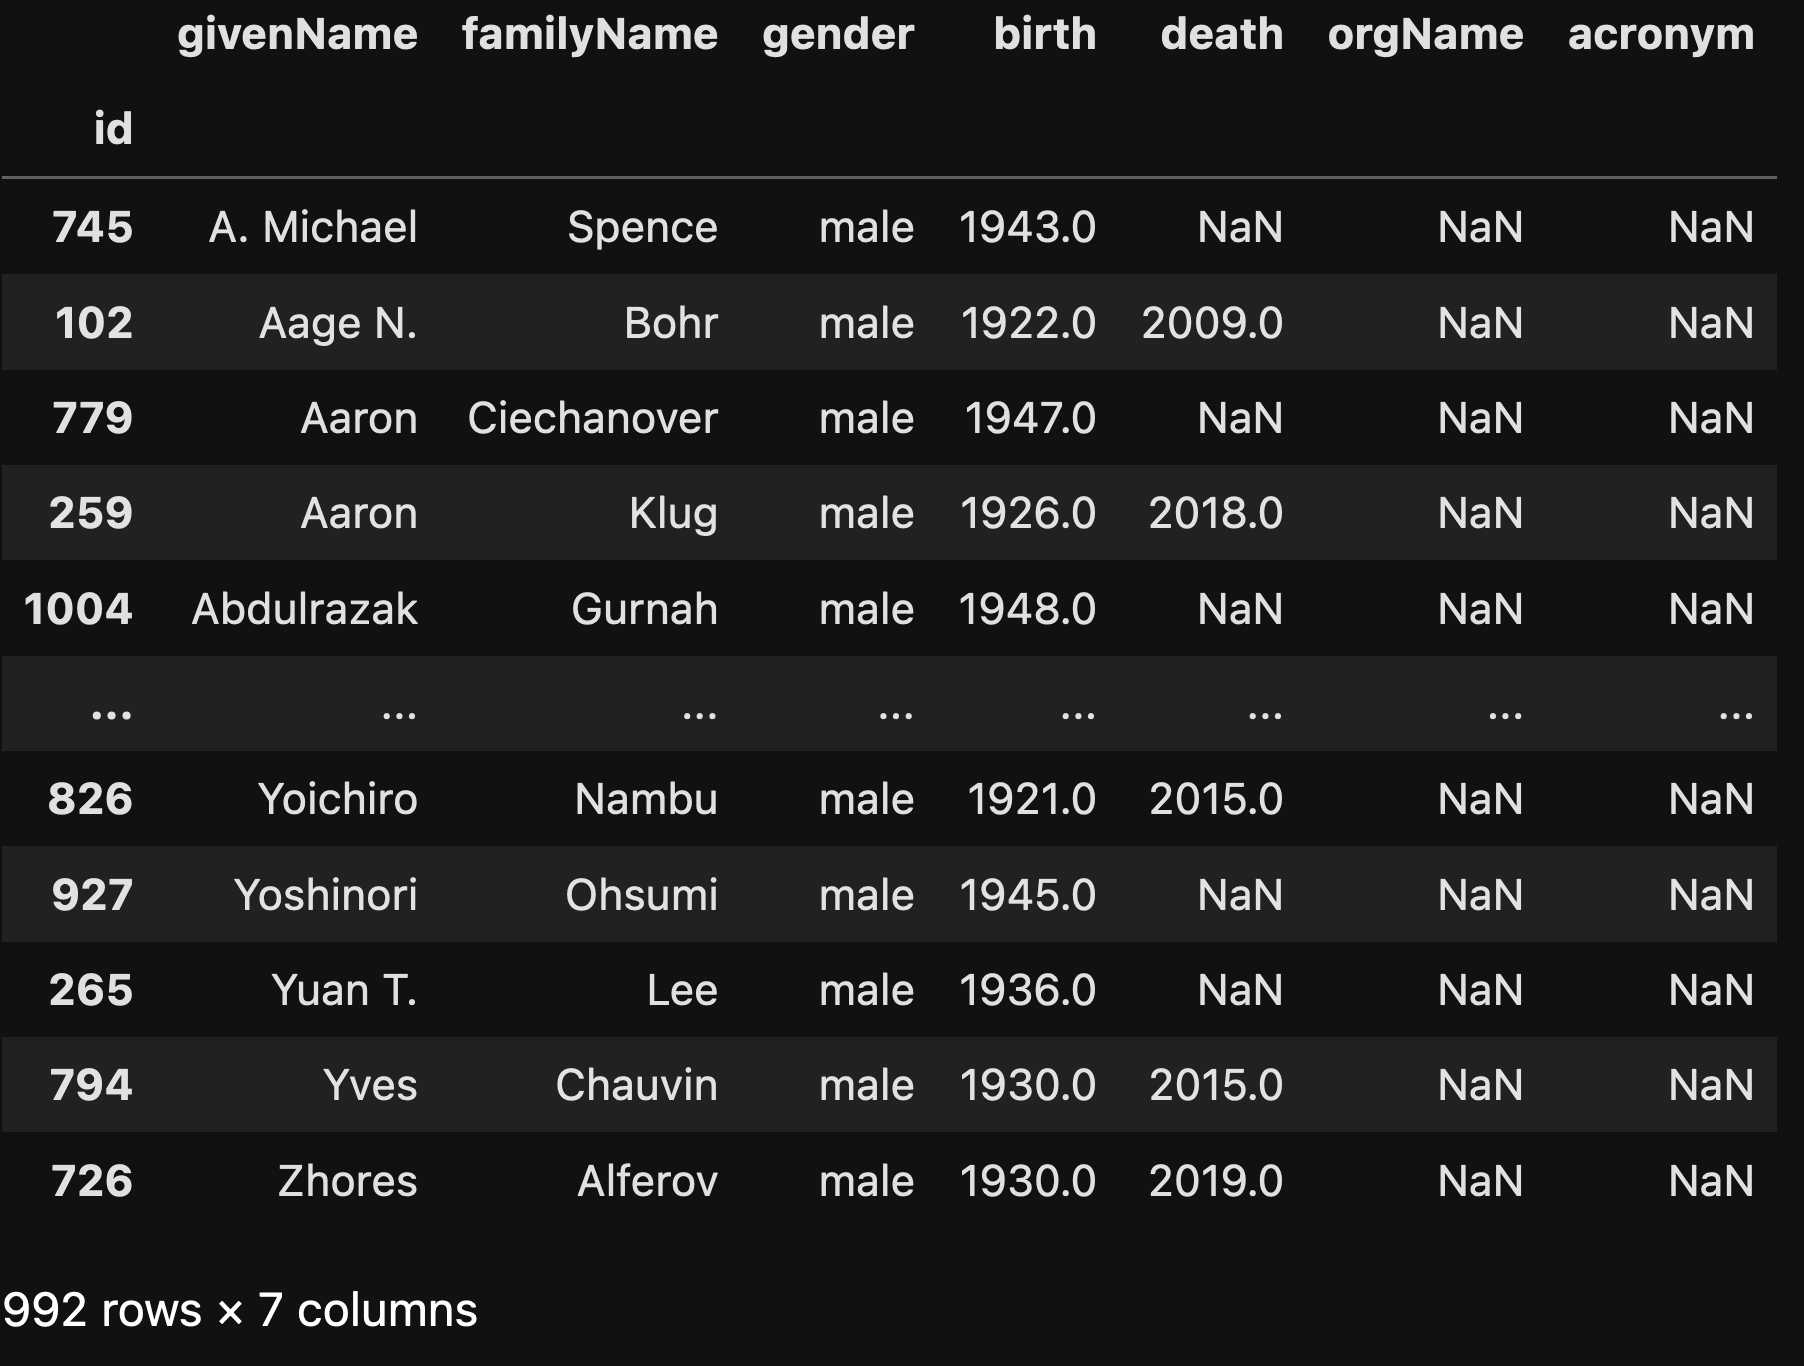
Here’s what the data frame looks like on my system:
We now have the basic data frames that we’ll need in order to perform some analysis. But before we can do that, we’ll need to do some more manipulation.
Create a data frame, prizes_laureates_df, from the "laureates" column of the "prizes" data frame, which currently contains dicts. The columns of this data frame should be: prize_id (referring to the index of the prizes data frame), laureate_id (referring to the laureate ID provided in the dict), portion, and sortOrder. When you're done creating this new data frame, delete the "laureates" column.
If we just want to analyze the laureates, we can now do that. If we want to just analyze the prizes, we can do that, as well. But any query that needs information about both of those will require us to join the two data frames together.
There are many ways that we could pull this off, but I’m going to use a technique that I learned working with relational databases and SQL: A join table.
In other words:
- One data frame will have information about the prizes, with a unique ID for each prize.
- Another data frame will have information about the laureates, with a unique ID for each laureate.
- A third data frame, our join table, will have one prize_id column, and another laureate_id column. That will allow us to stitch together all of the laureates for one prize, or all of the prizes for one laureate.
In our particular case, we’re going to include two more columns in the join table, the “portion” column (indicating what proportion of the prize the person won) and the “sortOrder” column (indicating how to sort the recipients for each price). I had no idea, until working on this data set, that the order of recipients is important; I figured that all of the recipients were given equal weight.
So, how can we create this join table? The good news is that we have the raw data in the “laureates” column of prizes_df. Each value in that column is a list of dicts, with each dict referring to a particular laureate:
0      [{'id': '160', 'knownName': {'en': 'Jacobus H....
1      [{'id': '569', 'knownName': {'en': 'Sully Prud...
2      [{'id': '462', 'knownName': {'en': 'Henry Duna...
3      [{'id': '1', 'knownName': {'en': 'Wilhelm Conr...
4      [{'id': '293', 'knownName': {'en': 'Emil von B...
                             ...
665    [{'id': '1034', 'knownName': {'en': 'Claudia G...
666    [{'id': '1032', 'knownName': {'en': 'Jon Fosse...
667    [{'id': '1033', 'knownName': {'en': 'Narges Mo...
668    [{'id': '1026', 'knownName': {'en': 'Pierre Ag...
669    [{'id': '1024', 'knownName': {'en': 'Katalin K...
Name: laureates, Length: 670, dtype: object
Our first task will be to unpack those lists of dicts. In other words, if the column’s first element is a list of two dicts and the second element is a list of three dicts, then I would like to get a series of five elements, in which each is a dict.
Fortunately, Pandas provides us with precisely such a tool, in the form of the “explode” method. Invoking “explode” on a series whose values are lists will return a new series whose values are the elements of those lists. I can thus say:
(
    prizes_df['laureates']
    .explode()
)
That returns the following series:
0      {'id': '160', 'knownName': {'en': 'Jacobus H. ...
1      {'id': '569', 'knownName': {'en': 'Sully Prudh...
2      {'id': '462', 'knownName': {'en': 'Henry Dunan...
2      {'id': '463', 'knownName': {'en': 'Frédéric Pa...
3      {'id': '1', 'knownName': {'en': 'Wilhelm Conra...
                             ...
668    {'id': '1026', 'knownName': {'en': 'Pierre Ago...
668    {'id': '1027', 'knownName': {'en': 'Ferenc Kra...
668    {'id': '1028', 'knownName': {'en': 'Anne L’Hui...
669    {'id': '1024', 'knownName': {'en': 'Katalin Ka...
669    {'id': '1025', 'knownName': {'en': 'Drew Weiss...
Name: laureates, Length: 1049, dtype: object
We’ll want to extract information about each laureate, from each dict. But it turns out that when the Nobel Prize was given to an organization, rather than to an individual, or if the prize goes unawarded, then the values is NaN. I decided to drop those NaN values:
(
    prizes_df['laureates']
    .explode()
    .dropna()
)
The result looks almost identical to what we got before, but as you can see, the “length” of the series (originally 1049) is now shorter (now 1000):
0      {'id': '160', 'knownName': {'en': 'Jacobus H. ...
1      {'id': '569', 'knownName': {'en': 'Sully Prudh...
2      {'id': '462', 'knownName': {'en': 'Henry Dunan...
2      {'id': '463', 'knownName': {'en': 'Frédéric Pa...
3      {'id': '1', 'knownName': {'en': 'Wilhelm Conra...
                             ...
668    {'id': '1026', 'knownName': {'en': 'Pierre Ago...
668    {'id': '1027', 'knownName': {'en': 'Ferenc Kra...
668    {'id': '1028', 'knownName': {'en': 'Anne L’Hui...
669    {'id': '1024', 'knownName': {'en': 'Katalin Ka...
669    {'id': '1025', 'knownName': {'en': 'Drew Weiss...
Name: laureates, Length: 1000, dtype: object
Things are looking better — but we can see that “knownName” and other columns again have sub-dicts with translations. For our join table, we don’t need all of that stuff; we just need three of the keys — laureate_id, portion, and sort_order. I want to take each of the dicts we have and replace it with the dict that we want. In order to do that, I’ll use “apply”, along with a lambda:
(
    prizes_df['laureates']
    .explode()
    .dropna()
    .apply(lambda d: {'laureate_id':d['id'],
                      'portion': d['portion'],
                      'sortOrder': d['sortOrder']})
)
This is looking pretty good! This is what I got from the above, a series of dicts with just these three keys:
0      {'laureate_id': '160', 'portion': '1', 'sortOr...
1      {'laureate_id': '569', 'portion': '1', 'sortOr...
2      {'laureate_id': '462', 'portion': '1/2', 'sort...
2      {'laureate_id': '463', 'portion': '1/2', 'sort...
3      {'laureate_id': '1', 'portion': '1', 'sortOrde...
                             ...
668    {'laureate_id': '1026', 'portion': '1/3', 'sor...
668    {'laureate_id': '1027', 'portion': '1/3', 'sor...
668    {'laureate_id': '1028', 'portion': '1/3', 'sor...
669    {'laureate_id': '1024', 'portion': '1/2', 'sor...
669    {'laureate_id': '1025', 'portion': '1/2', 'sor...
Name: laureates, Length: 1000, dtype: object
You might be asking: Wait, we have the laureate_id, but where is the prize_id? Where will that come from? And the answer is that the series index is the prize_id. How? Because this series comes from the original prizes_df, which means that the index will match that data frame. And as you can see toward the bottom of the above excerpt, the index repeats when the same prize has multiple recipients.
We’ll get back to the prize_id in a moment. But first, we have a bigger problem, namely how do we turn our series of dicts into a data frame?
You’re going to love this: We apply the Series class:
(
    prizes_df['laureates']
    .explode()
    .dropna()
    .apply(lambda d: {'laureate_id':d['id'],
                      'portion': d['portion'],
                      'sortOrder': d['sortOrder']})
    .apply(Series)
)
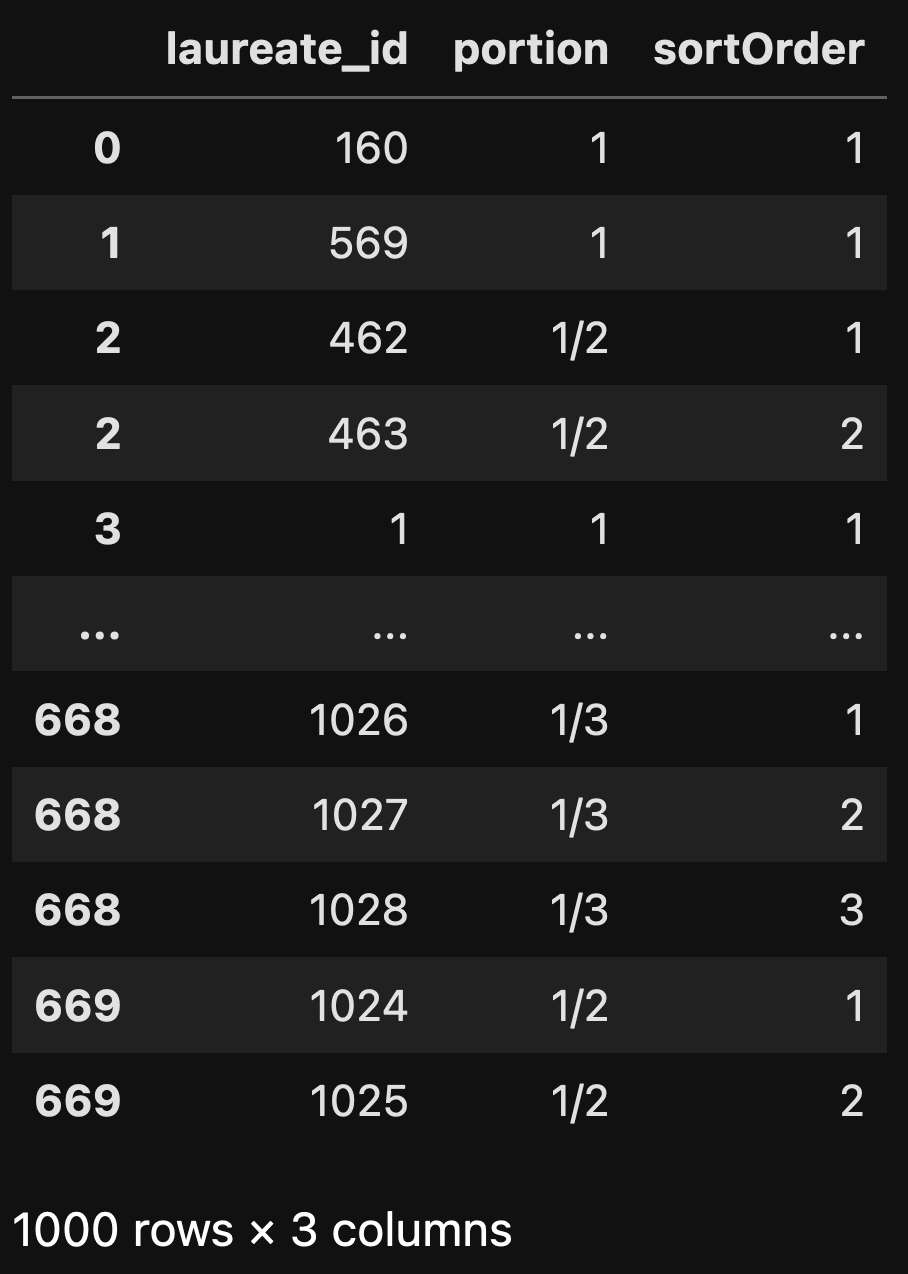
The result is a data frame, one with our original (prizes_df) index, and with three columns: laureate_id, portion_id, and sortOrder:
I have to say, I think that this is a pretty cool trick.
But we’re not quite done, because we want the index to be a regular column called “prize_id”, rather than the index of our data frame. We can do that by resetting the index (using “reset_index”, which moves the index to be a regular column, and then using “rename” to rename the “index” column.
While I’m at it, I’ll assign the results to a variable, prizes_laureates_df:
prizes_laureates_df = (
    prizes_df['laureates']
    .explode()
    .dropna()
    .apply(lambda d: {'laureate_id':d['id'],
                      'portion': d['portion'],
                      'sortOrder': d['sortOrder']})
    .apply(Series)
    .reset_index()
    .rename(columns={'index':'prize_id'})
)
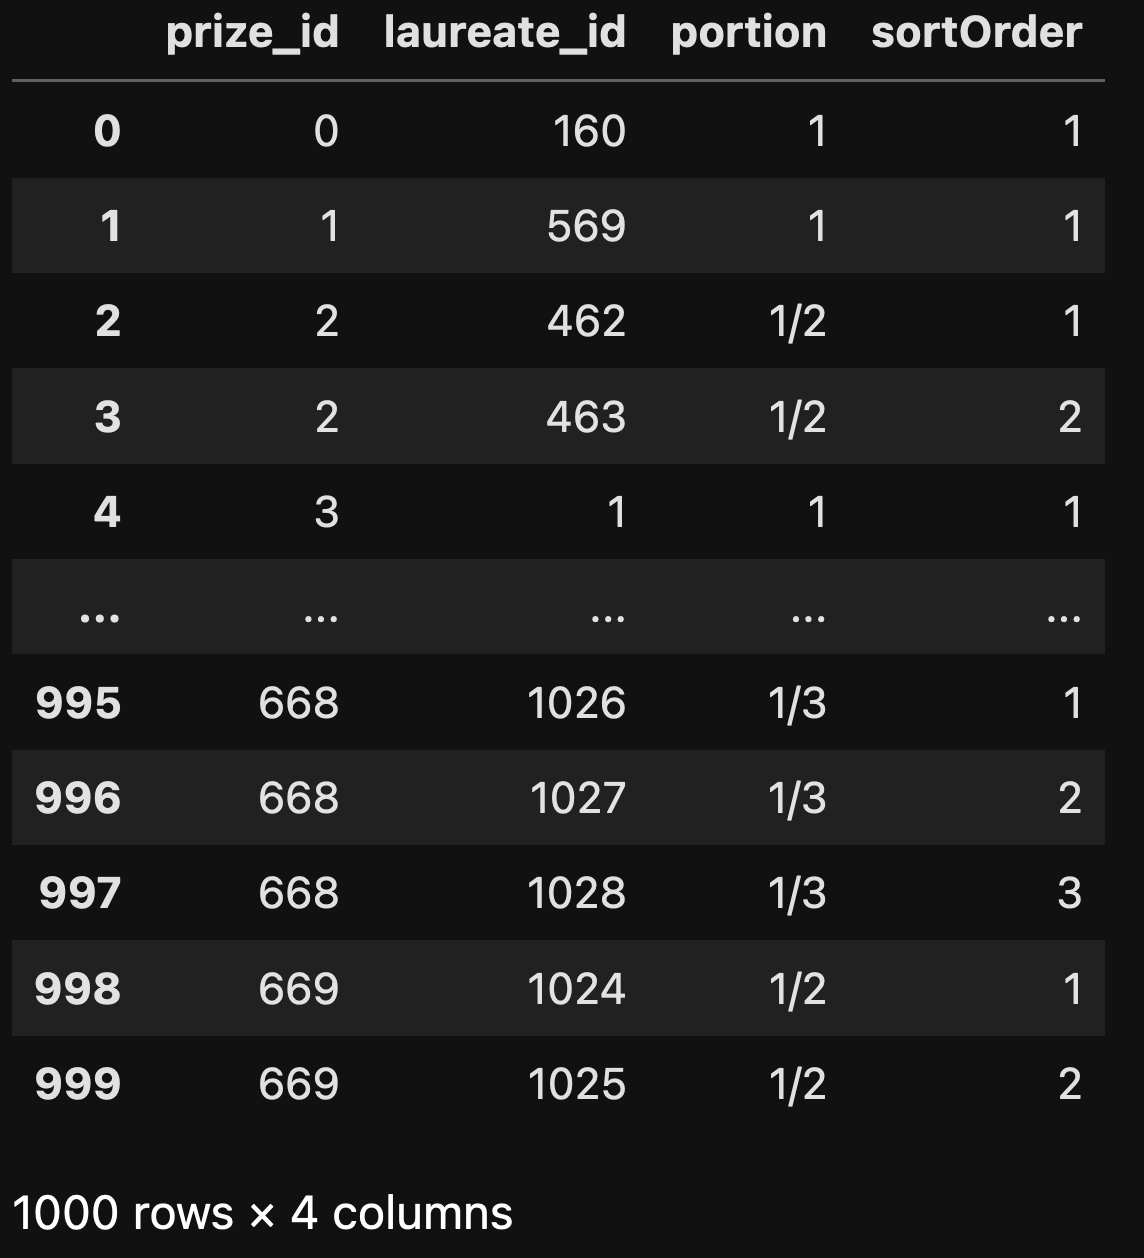
We now have a new data frame which can act as a join table:
Finally, we can remove the “laureates” column from prizes_df with the “drop” method:
prizes_df = prizes_df.drop('laureates', axis='columns')With that set, we’re now ready to perform some queries.
Who has won more than one Nobel Prize?
To find out who has won more than one Nobel Prize, we’ll need to do the following:
- Count how many times each person_id is mentioned in our join table
- Join that table with laureates_df, so that we can get their names.
Let’s start by counting how many times each laureate_id appears in our join table. We can do this by invoking value_counts on the “laureate_id” column of prizes_laureates_df:
(
    prizes_laureates_df['laureate_id']
    .value_counts()
)
The result is a series in which the laureate_id is in the index, and the count is the value:
laureate_id
482     3
217     2
66      2
743     2
515     2
       ..
228     1
229     1
635     1
523     1
1025    1
Name: count, Length: 992, dtype: int64
Now we want to keep only those elements of the series in which the value is more than 1. There are a few ways to do this, but we can use .loc and a lambda:
(
    prizes_laureates_df['laureate_id']
    .value_counts()
    .loc[lambda s: s > 1],
)
Here, we’re saying that we want to select those series in which the value is > 1. The result:
laureate_id
482    3
217    2
66     2
743    2
515    2
222    2
6      2
Name: count, dtype: int64
You could argue that we’ve answered the question; the laureates with IDs listed in the index have won it more than once. But it might be nice to get and display their names. To do that, we’ll join the laureates_df with the series that we just got here.
Since “join” is only a method that we can run on a data frame, rather than a series, I’ll run it like this:
laureates_df.join(
    prizes_laureates_df['laureate_id']
    .value_counts()
    .loc[lambda s: s > 1]
)
Here, we say that we want to find where the index of laureates_df and the result of our filtered call to valud_counts match. Then we’ll get a new, wide data frame containing both the columns from laureates_df and the values from the series.
The only problem is that we’ll get a row for every row in laureates_df. Why? Because by default, Pandas uses what’s known as a “left join,” meaning that the left-hand side dictates what rows will be around. We’ll just get NaN values wherever the filtered value_counts output didn’t exist.
To get around that, we can tell “join” to do a “right join,” passing the “how” keyword argument to the method:
laureates_df.join(
    prizes_laureates_df['laureate_id']
    .value_counts()
    .loc[lambda s: s > 1],
    how='right'
)
Sure enough, this does the trick:
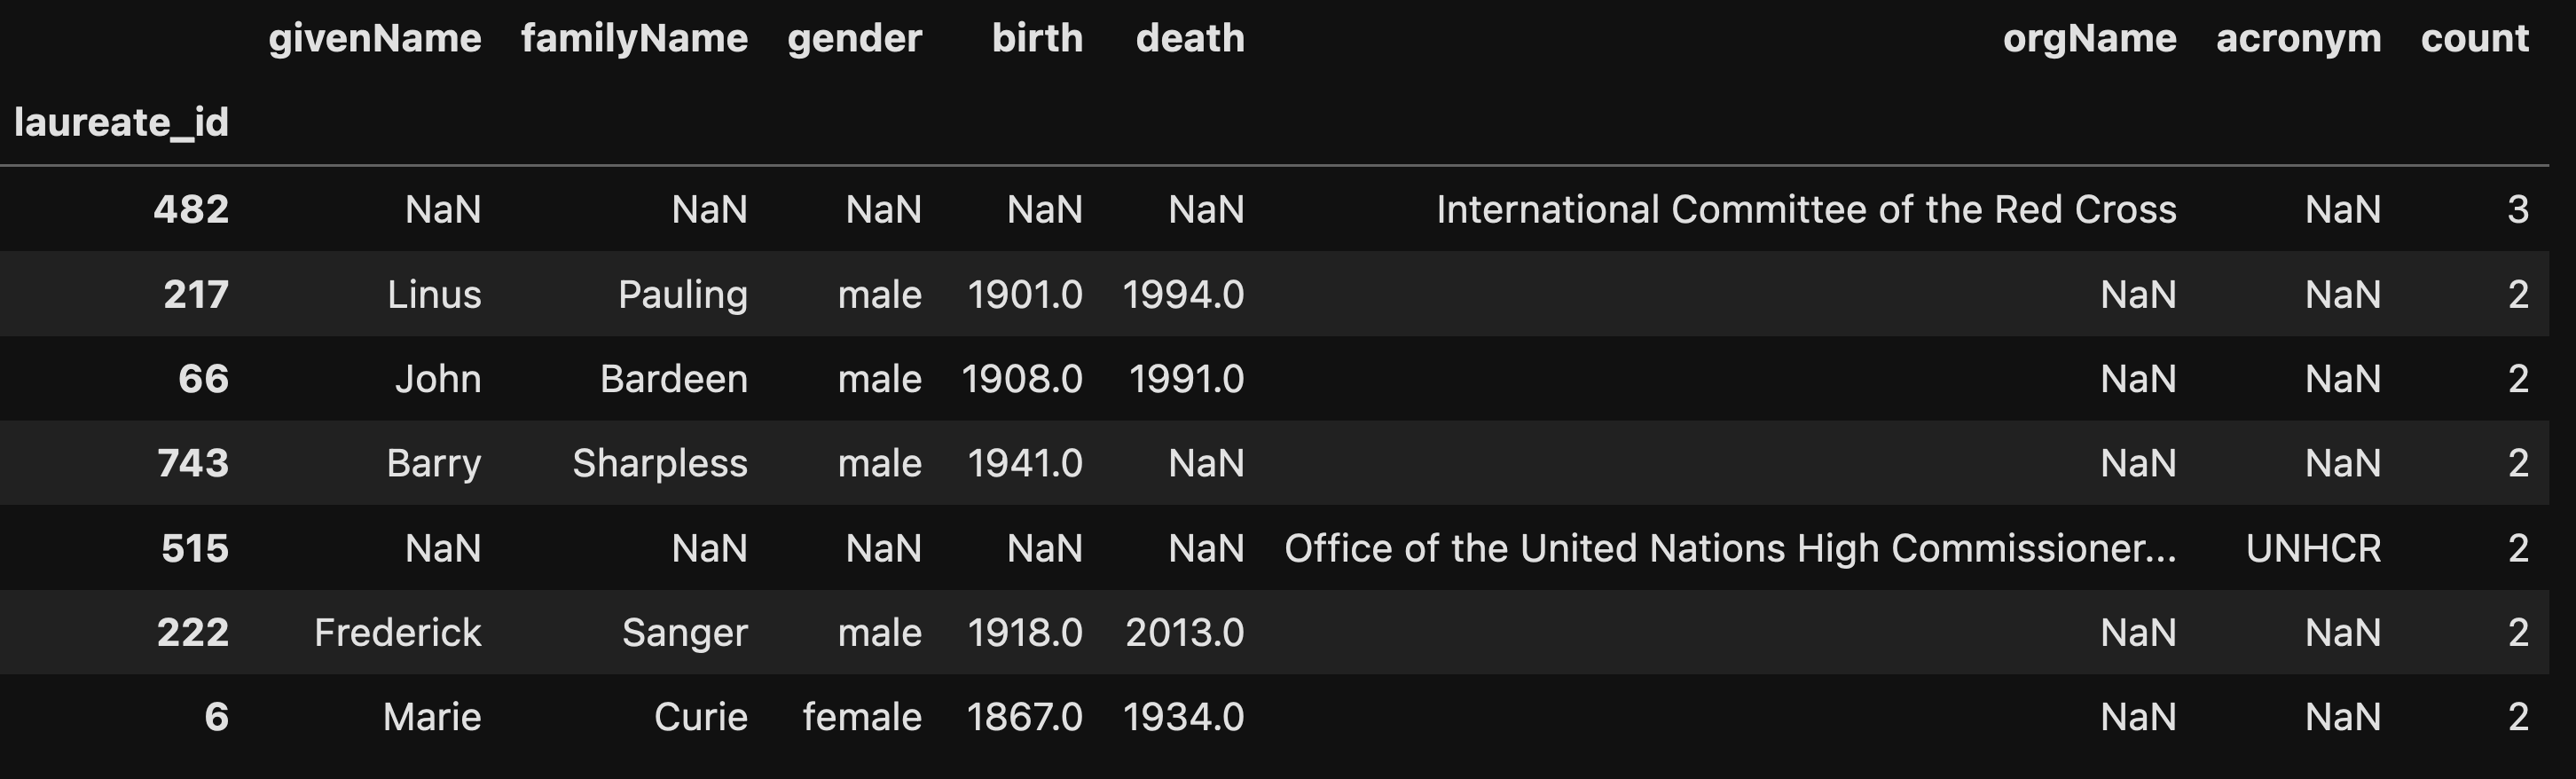
We can see that five people and one organization have won it twice, and the International Committee of the Red Cross has won it three times. Wow!
What percentage of Nobel laureates is female?
Our laureates_df contains a “gender” column, which contains “male”, “female”, or NaN (for organizations). If we want to know the number of “female” values in “gender”, we can say:
laureates_df['gender'].value_counts()This gives us the raw numbers:
gender
male      901
female     64
Name: count, dtype: int64
It turns out that if we call value_counts with the keyword argument normalize=True, we can get the percentages instead:
laureates_df['gender'].value_counts(normalize=True)From this, we get:
gender
male      0.933679
female    0.066321
Name: proportion, dtype: float64
Finally, we can get it in a slightly nicer-to-read percentage format by multiplying by 100:
laureates_df['gender'].value_counts(normalize=True) * 100The result we get here is:
gender
male      93.367876
female     6.632124
Name: proportion, dtype: float64
We can thus see that about 6.6 percent of Nobel laureates are female. I didn’t check to see if that percentage has gone up per decade, but I have to assume (hope?) that it is the case.
What percentage of Nobel laureates is female for each prize?
Now let’s ask a slightly trickier question, namely: What percentage of Nobel laureates is female for each prize?
If this sounds like a grouping problem, you’re right! And if this sounds like a joining problem, you’re right about that, too! We’ll need to use both techniques in order for this to work.
That’s because we’ll now need to join three data frames together:
- prizes_df, to get the prize categories,
- prizes_laureates_df, to connect prizes and laureates, and
- laureates_df, to get the gender
Let’s start by joining the three data frames together. The “join” method assumes that we’re going to join the index of one with the index of another. It’s thus important for the indexes to match up. (If you want a more general method, one that doesn’t make such assumptions, check the “merge” method.)
If the data frame on which we’re invoking “join” should use a different column, then we can specify it with “on”.
I’ll thus do our three-way merge as follows:
(
    prizes_df
    .join(prizes_laureates_df.set_index('prize_id'))
    .join(laureates_df, on='laureate_id')
)
We now have a very wide data frame, in which each row represents one laureate from one prize. We don’t actually care about all of these columns, so we can keep just the three that’ll be useful, namely category, gender, and awardYear.
Wait — why do I want to keep awardYear? Because I’ll need at least one column on which to do my grouping:
(
    prizes_df
    .join(prizes_laureates_df.set_index('prize_id'))
    .join(laureates_df, on='laureate_id')
    [['category', 'gender', 'awardYear']]
)
Now we basically want to do a two-way grouping:
- Grouping by category
- Grouping by gender
I’m going to do a pivot table here (using the “pivot_table” method), setting the index (rows) to be the prize categories, and the columns to be genders. Normally, a pivot table calculates the mean of some value, but we can tell it to use a different aggregation method by passing the “aggfunc” keyword argument. Plus, we need something to count; that’s why I brought along “awardYear”:
(
    prizes_df
    .join(prizes_laureates_df.set_index('prize_id'))
    .join(laureates_df, on='laureate_id')
    [['category', 'gender', 'awardYear']]
    .pivot_table(index='category', columns='gender', values='awardYear', aggfunc='count')
)
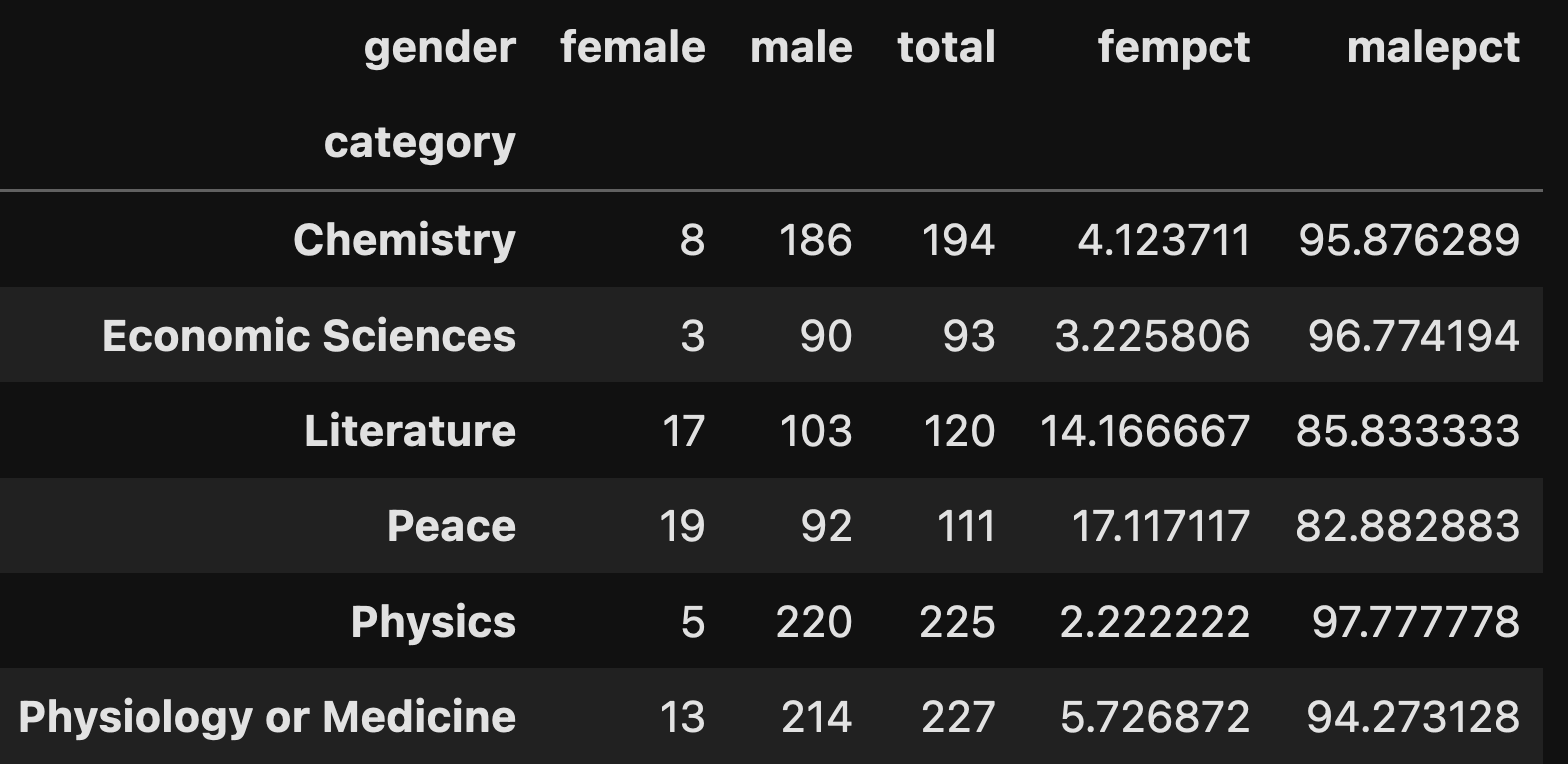
The result is a data frame with the raw information we want. But I want to know what percentage of each prize was given to men and women. I can do that by creating three new columns:
- total, the sum of all values (male + female) in each row,
- fempct, the percentage of female in the total for each row, and
- malepct, the percentage of male in the total for each row.
Here’s how I did it, using assign:
(
    prizes_df
    .join(prizes_laureates_df.set_index('prize_id'))
    .join(laureates_df, on='laureate_id')
    [['category', 'gender', 'awardYear']]
    .pivot_table(index='category', columns='gender', values='awardYear', aggfunc='count')
    .assign(total=lambda df_: df_.sum(axis='columns'),
            fempct=lambda df_: df_['female'] / df_['total'] * 100,
            malepct=lambda df_: df_['male'] / df_['total'] * 100
            )
 )
The result is a data frame with six rows and five columns:
Now let’s tidy things up a bit, removing the first three columns and rounding the percentages:
(
    prizes_df
    .join(prizes_laureates_df.set_index('prize_id'))
    .join(laureates_df, on='laureate_id')
    [['category', 'gender', 'awardYear']]
    .pivot_table(index='category', columns='gender', values='awardYear', aggfunc='count')
    .assign(total=lambda df_: df_.sum(axis='columns'),
            fempct=lambda df_: df_['female'] / df_['total'] * 100,
            malepct=lambda df_: df_['male'] / df_['total'] * 100
            )
    .drop(['female', 'male', 'total'], axis='columns')
    .map(lambda x: round(x, 2))
)
Notice that I use “drop” to remove the columns I don’t want; I could just as easily have used double square brackets to indicate which columns I did want to keep.
I then used map to round each of these numbers to two digits, and here’s what I got:
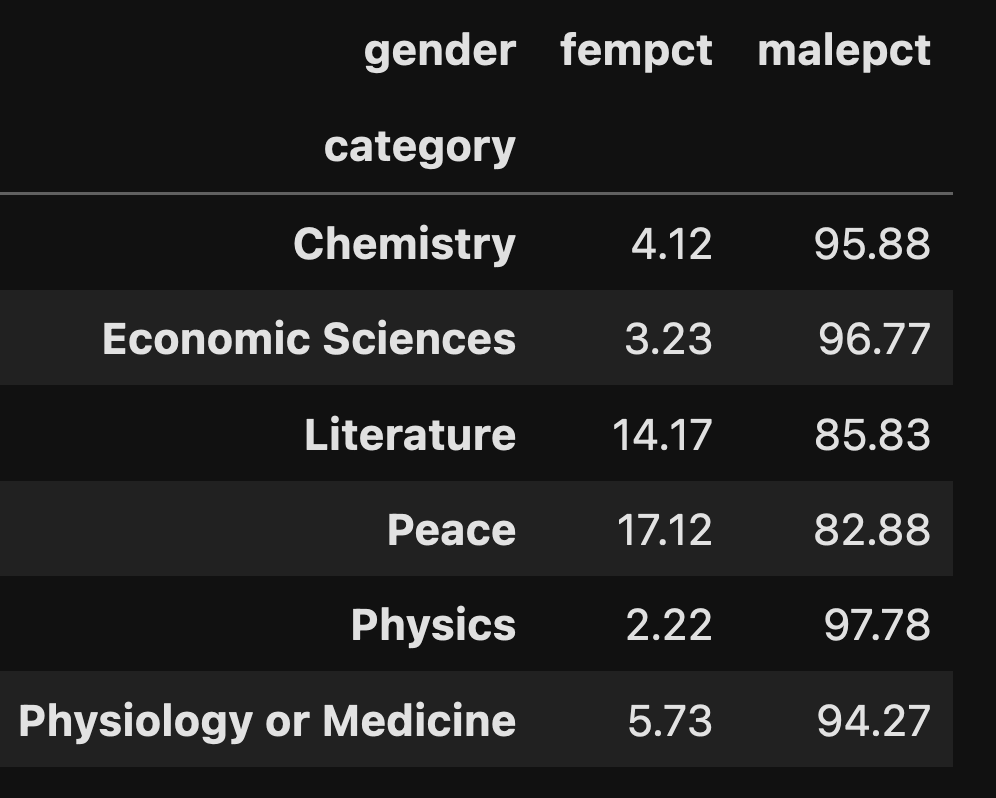
We can see that as a percentage, the best women have done is approximately 17 percent in the peace prize, followed by 14 percent for the literature prize.
The others are pretty low — but this year, Claudia Goldin won the economics prize this year, Katalin Kariko won the medicine prize, and Anne L’Huillier won the chemistry prize.
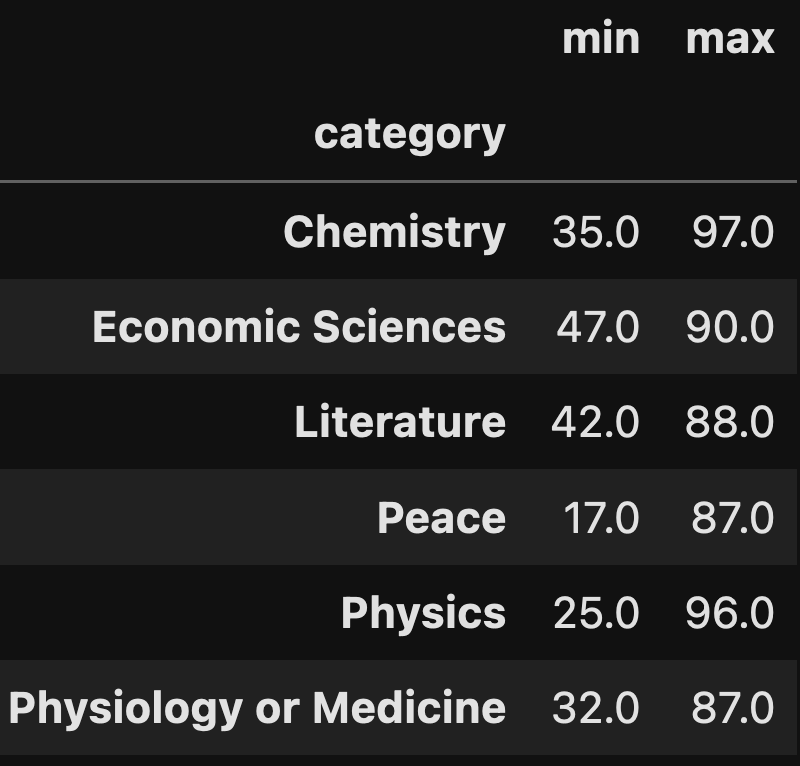
How old were the youngest and oldest recipients of each award when they received it?
To answer this question, we’ll again have to join our three basic data frames together:
(
    prizes_df
    .join(prizes_laureates_df.set_index('prize_id'))
    .join(laureates_df, on='laureate_id')
 )
Now what? We’ll have to calculate the difference between awardYear and the year of birth. I’ll use “assign” to do this, putting the result in a new “age_at_award” column:
(
    prizes_df
    .join(prizes_laureates_df.set_index('prize_id'))
    .join(laureates_df, on='laureate_id')
    .assign(age_at_award=lambda df_:df_['awardYear'] - df_['birth'])
)
With this in place, we can now perform a grouping operation (with “groupby”), calculating the min and max value of age_at_award for each category:
(
    prizes_df
    .join(prizes_laureates_df.set_index('prize_id'))
    .join(laureates_df, on='laureate_id')
    .assign(age_at_award=lambda df_:df_['awardYear'] - df_['birth'])
    .groupby('category')['age_at_award'].agg(['min', 'max'])
)
While we would normally invoke “min” or “max” as part of a grouping operation, here we want to use both of them. We thus use the “agg” function, which takes a list of the aggregation functions we want to use, and produces an answer for each one:
What percentage of the time has the prize in each category been awarded to a single person? How often has it been divided, and into how many pieces has it been divided?
Finally, we know that the prize is sometimes awarded to one person, and at other times it’s awarded to more than one. How often does each situation happen?
Once again, we’ll need to perform a join — but this time, we can get away with just joining two data frames, prizes_df and prizes_laurates_df:
(
    prizes_df
    .join(prizes_laureates_df.set_index('prize_id'))
)
With that in place, we can now narrow things down to have only two columns, for the category and the portion:
(
    prizes_df
    .join(prizes_laureates_df.set_index('prize_id'))
    [['category', 'portion']]
)
We now have only those two columns. But now what? We basically want to count how often each value of “portion” occurs per “category”. That sounds like a grouping operation, but what aggregation method will we use?
The answer might surprise you; we can use value_counts, passing normalize=True in order to get the percentages:
(
    prizes_df
    .join(prizes_laureates_df.set_index('prize_id'))
    [['category', 'portion']]
    .groupby('category').value_counts(normalize=True)
)
The result that I got was:
category                portion
Chemistry               1          0.324742
                        1/2        0.298969
                        1/3        0.293814
                        1/4        0.082474
Economic Sciences       1/2        0.440860
                        1          0.279570
                        1/3        0.258065
                        1/4        0.021505
Literature              1          0.933333
                        1/2        0.066667
Peace                   1          0.496454
                        1/2        0.439716
                        1/3        0.063830
Physics                 1/2        0.373333
                        1/3        0.240000
                        1          0.208889
                        1/4        0.177778
Physiology or Medicine  1/3        0.409692
                        1/2        0.343612
                        1          0.176211
                        1/4        0.070485
Name: proportion, dtype: float64
And there you have it!
My Jupyter notebook is here: https://drive.google.com/file/d/1bhl8pdqoPBXd8VNu28q_Wtxfo_MXj8UI/view?usp=sharing
Questions or comments? Send them my way!
I’ll be back next Wednesday with another set of Pandas-related questions taken from current events.
Reuven