


This week, we looked through 40 years of hurricane data from the US government's NOAA (National Oceanic and Atmospheric Administration), and specifically the NOAA's National Centers for Environmental Information (NCEI). This government agency tracks and publishes data about hurricanes, among other things.
Why hurricanes? Because September is usually the peak of hurricane season in the Atlantic Ocean – but this year, there have been surprisingly few. (See the New York Times story on this topic from a few days ago.) This is apparently connected to El Niño, which tears storms apart before they can strengthen.
Our data-analysis questions this week looked at how many hurricanes usually form in the Atlantic at this time of year, how strong they are, and what we can say about this year's hurricanes.
Data and five questions
Up-to-date data about this year's hurricanes are in a NCEI system known as International Best Track Archive for Climate Stewardship, abbreviated to IBTrACS. CSV versions of their data are at:
We'll work with the CSV file containing data from 1980 through the present day, called ibtracs.since1980.list.v04r01.csv. You can download it from:
Paid subscribers, both to Bamboo Weekly and to my LernerPython+data membership program (https://LernerPython.com) get all of the questions and answers, as well as downloadable data files, downloadable versions of my notebooks, one-click access to my notebooks, and invitations to monthly office hours.
Learning goals for this week include: Reading CSV files, cleaning data, plotting with Plotly, grouping, and dates and times.
Here are my solutions and explanations for this week's five questions:
Read the CSV file into a Pandas data frame. We only care about the columns 'SID', 'SEASON', 'NUMBER', 'BASIN', 'NAME', 'NATURE', 'ISO_TIME', 'IFLAG', 'LAT', 'LON', and 'USA_WIND'. Make sure that ISO_TIME is a datetime and that the numeric columns are indeed numeric. This file uses an empty string and a single space character for NaN, and uses NA for "North Atlantic," so watch out for that, too. Keep only original (i.e., non-interpolated) data, meaning those in which the first character of IFLAG is O. Ignore the 2nd row in the file, which lists the units.
I started off by loading Pandas and Plotly:
import pandas as pd
from plotly import express as px
Now, reading a CSV file into Pandas is normally pretty straightforward, given that read_csv does just about everything we would want. But this file turned out to be somewhat challenging!
The first challenge was the fact that column names were in the first row (index 0), then some columns had strings describing the units used in the second row (index 1), and then the data actually came starting in the third row (index 2). We could have a two-level multi-index on the columns, which would be annoying to work with. Or we could read everything, have string dtypes on all columns, remove the first row, and then manually change the dtypes.
But I did it a different way, using the skiprows keyword argument to read_csv. Normally, skiprows indicates how many rows to ignore until we get to the column headers. So saying skiprows=1 would have used row index 1, aka the units, as the column headers – not what I wanted. Instead, I used skiprows=[1], giving it a list, and it worked just fine, skipping row 1, keeping the column headers, keeping the data, and giving good dtypes:
filename = 'data/bw-188-ibtracs.since1980.zip'

df = (
    pd
    .read_csv(filename, skiprows=[1])
)
Next, I wanted to deal transforming ISO_TIME into a datetime dtype, and handling NaN values. Telling it about ISO_TIME was actually the easy part here; I just passed the parse_dates keyword argument, and it worked fine.
But NaN was a bit trickier, because this file had two annoying features:
- First, it used
NAas an actual value! So we had to tell it not to seeNAas aNaNvalue, which is the default. I've been bitten by this problem before, and it's never something you expect. I removed the default list ofNaNstrings withkeep_default_na=False. - Then I had to say what is considered
NaN, and that was also non-standard, consisting of the empty string and a single space character. I passed the keyword argumentna_valueswith a list of the two strings that I did want to have parsed asNaN.
That left me with:
filename = 'data/bw-188-ibtracs.since1980.zip'

df = (
    pd
    .read_csv(filename, skiprows=[1],
              parse_dates=['ISO_TIME'],
              keep_default_na=False,
              na_values=['', ' '])
)
Because CSV is a text format, Pandas tries to decide what dtype to assign to each column it reads – basically, choosing from int64, float64, or str (if it's neither). In the case of a large file, it reads the file in chunks, and makes the evaluation with each chunk separately.
What if the heuristic gives different opinions for different chunks? You'll get a warning, indicating that you should either specify dtypes in a dict or indicate low_memory=False, which lets the file be read into memory all at once. I opted for the latter.
Note that I tried to use the PyArrow engine for loading the file, but it didn't like the use of a list with skiprows, so I used the default Pandas parser.
Then, after indicating that my computer has enough memory to read everything in at once, I specified which columns I wanted with usecols:
filename = 'data/bw-188-ibtracs.since1980.zip'

df = (
    pd
    .read_csv(filename, skiprows=[1],
              parse_dates=['ISO_TIME'],
              keep_default_na=False,
              na_values=['', ' '],
              low_memory=False,
              usecols=['SID', 'SEASON', 'NUMBER', 'BASIN', 'NAME', 'NATURE',
                       'ISO_TIME', 'IFLAG', 'LAT', 'LON', 'USA_WIND'])
)
Finally, I told you that I only wanted to keep rows with original data, rather than interpolated values. I did this by checking the first character of IFLAG with str.startswith, keeping the row if it started with "O". Once that column had served its function, I removed it with drop:
filename = 'data/bw-188-ibtracs.since1980.zip'

df = (
    pd
    .read_csv(filename, skiprows=[1],
              parse_dates=['ISO_TIME'],
              keep_default_na=False,
              na_values=['', ' '],
              low_memory=False,
              usecols=['SID', 'SEASON', 'NUMBER', 'BASIN', 'NAME', 'NATURE',
                       'ISO_TIME', 'IFLAG', 'LAT', 'LON', 'USA_WIND'])
    .loc[pd.col('IFLAG').str.startswith('O')]
    .drop(columns='IFLAG')
)
The result was a data frame with 132,075 rows and 10 columns.
Create a bar plot showing the number of hurricanes in each season in the data set, in the North Atlantic basin. (Those are storms with a TS value in NATURE and with a USA_WIND of at least 64.) Now create a bar plot showing the number of hurricanes in the North Atlantic basin through September 15th of each, so we can compare 2026 with previous years. Do we see fewer hurricanes this year? Is this part of a trend, or an exceptional year?
Next, I wanted to find out how many hurricanes were tracked each year. To do that, I used several invocations of loc together with pd.col for a number of conditions: Only where BASIN is 'NA', only where NATURE is 'TS', and only where USA_WIND is at least 64.
That gave me all of the hurricanes in the North Atlantic basin, but I wanted to know how many there were each year. I used .dt.year to grab the year from ISO_TIME, and used assign to create a year column.
I then used groupby, grouping by year, counting the number of unique hurricane ID numbers (i.e., SID) in each year. That gave me a series with the years in the index and the count as the values.
I invoked pipe, and passed the series to px.bar:
(
    df
    .loc[pd.col('BASIN') == 'NA']
    .loc[pd.col('NATURE') == 'TS']
    .loc[pd.col('USA_WIND') >= 64]
    .assign(year = pd.col('ISO_TIME').dt.year)
    .groupby('year')['SID'].nunique()
    .pipe(px.bar)
)
The result:
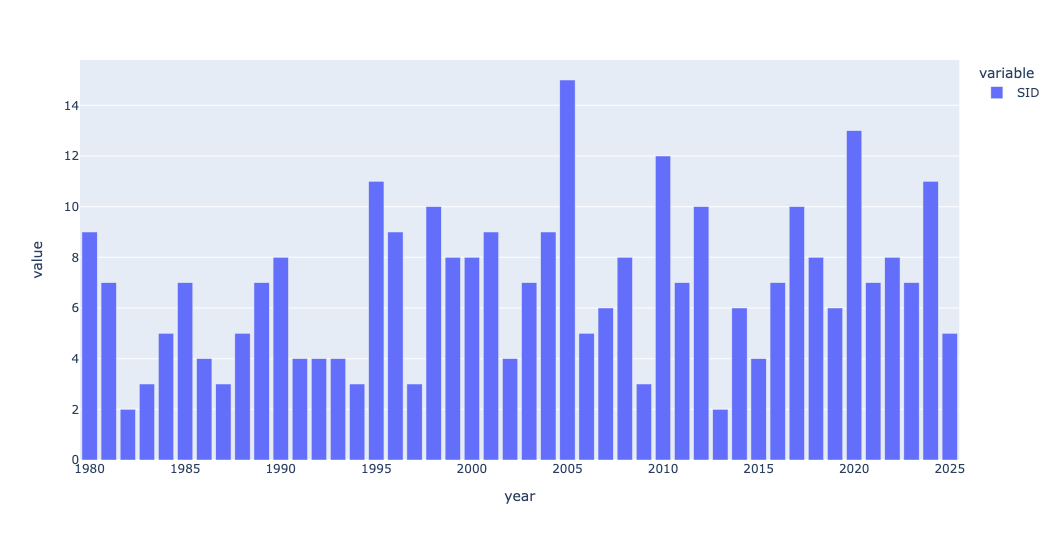
This is great, except for two things:
Do you see a bar for 2026? No, you don't! That's because there haven't been any hurricanes so far in the 2026 season. That gives us a unique-value count of 0, which translates into no bar at all.
The other issue is that if we're to make an apples-to-apples comparison, looking only at hurricanes on or before September 15th. I thus asked you to redo the query (and the plot), but only looking at hurricanes that took place on or before that date.
My solution was to use dt.strftime , which returns a string based on a datetime value – and we specify what that string should look like with a string-format specifier (see https://www.strfti.me/ for a great reference), showing the month and day:
(
    df
    .loc[pd.col('BASIN') == 'NA']
    .loc[pd.col('NATURE') == 'TS']
    .loc[pd.col('USA_WIND') >= 64]
    .assign(year = pd.col('ISO_TIME').dt.year)
    .loc[pd.col('ISO_TIME').dt.strftime('%m-%d') <= '09-15']
    .groupby('year')['SID'].nunique()
    .pipe(px.bar)
)
The resulting plot looked similar in some ways, but at least was a fairer comparison:
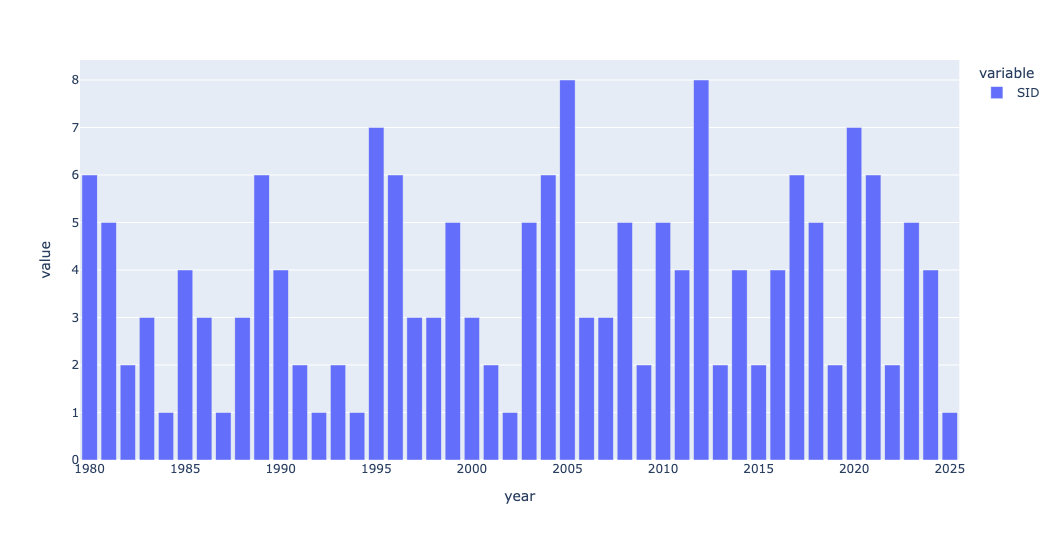
I do see something of a downward trend here, at least in the last few years. And if there are indeed zero hurricanes in the last North Atlantic basin of late, then that number would show a decline in each of the last four years.