


[I'm at Euro Python in Prague this week. If you're attending, then please find me and say "hi"!]
This week, we looked at data from the recent Parliamentary elections in the United Kingdom, one in which Sir Keir Starmer's Labour party swept into victory, ousting the Conservatives after 14 years. One of the many advantages of democracies over other governing systems is that they're more transparent – and in the modern age, this means that they make election data available to the public in digital form. This week, we'll thus look at the official UK election results, seeing what insights we can get.
Data and six questions
This week's data comes from the House of Commons library, part of the UK's Parliament. The full research briefing, including charts and graphs, can be read at
https://commonslibrary.parliament.uk/research-briefings/cbp-10009/
They provide two Excel spreadsheets, one describing the winners of the recent elections, split up per electoral district (known as a "constituency"). A similar, companion document, lists the members who were defeated. You can download them from here:
https://researchbriefings.files.parliament.uk/documents/CBP-10009/Winning-members.xlsx
https://researchbriefings.files.parliament.uk/documents/CBP-10009/Defeated-MPs.xlsx
Below are solutions to the six challenges that I posed yesterday. A link to my Jupyter notebook is, as always, at the end of this post:
Load the two files into a single data frame, with one row for each constituency, and the index being the ons_id columns from each. Columns from the defeated file should have the _defeated suffix attached to their names.
Before doing anything else, I loaded Pandas:
import pandas as pdNext, I defined two variables with the filenames I want to load:
uk_defeated_filename = 'Defeated-MPs.xlsx'
uk_winning_filename = 'Winning-members.xlsx'
Next, I used read_excel to load the first Excel file into a data frame. I passed index_col='ons_id' for that column (as identified in the first row of the Excel file, much like a CSV file) to be our data frame's index:
uk_winning_df = pd.read_excel(uk_winning_filename,
                             index_col='ons_id')
Next, I loaded the second Excel file into a data frame. However, I kept only a few of the columns, using the usecols keyword argument; the others weren't going to be used in any of our queries, and it annoyed me to have so many unused columns around. I also always forget that the column I mention in index_col must be listed in usecols. Here's the command I ended up using:
uk_defeated_df = (pd
                  .read_excel(uk_defeated_filename,
                              index_col='ons_id',
                              usecols=['ons_id','party_name',
                                     'firstname', 'middlenames',
                                     'surname', 'gender'])
                 )
I then created a single data frame from the two of these. Because ons_id is the index for both data frames, I can use join to combine them horizontally.
However, column names in Pandas cannot repeat; this is different from the index, where they can. Thus, when we join our two data frames together, we have to resolve the duplicated names by passing rsuffix, which indicates what suffix should be added to the right-hand data frame's column names. (There's also lsuffix, and you can use one or both of them.)
df = uk_winning_df.join(uk_defeated_df, rsuffix='_defeated')
The resulting data frame has 652 rows and 20 columns.
Which party won the greatest number of seats in each region? Which party lost the greatest number of seats in each region?
We know that the Labour party won the overall election. This means that a majority (an overwhelming majority, in fact) of members of Parliament are from Labour. I wanted to know, though, which party won the greatest number of seats — and yes, my original question said "votes," but we don't have that data — in each region. The data divides the UK into regions, and I was curious to know which regions moved from one party to another.
The regions are categorical information, and the party names are, as well. So if your instinct was to use groupby, then that's great – but here, we're grouping by two different categorical columns, which lends itself nicely to a pivot table. I'll invoke pivot_table, telling Pandas to use party names for the rows (index) and region names for the columns. We'll use the count aggregation method, and then it doesn't really matter what column we use for counting, so long as it doesn't have any missing values – so I chose country_name. The query thus looks like this:
(
    df
    .pivot_table(index='party_name',
                 columns='region_name',
                 values='country_name',
                 aggfunc='count')
    .idxmax()
)
Here's a screenshot of what I got:
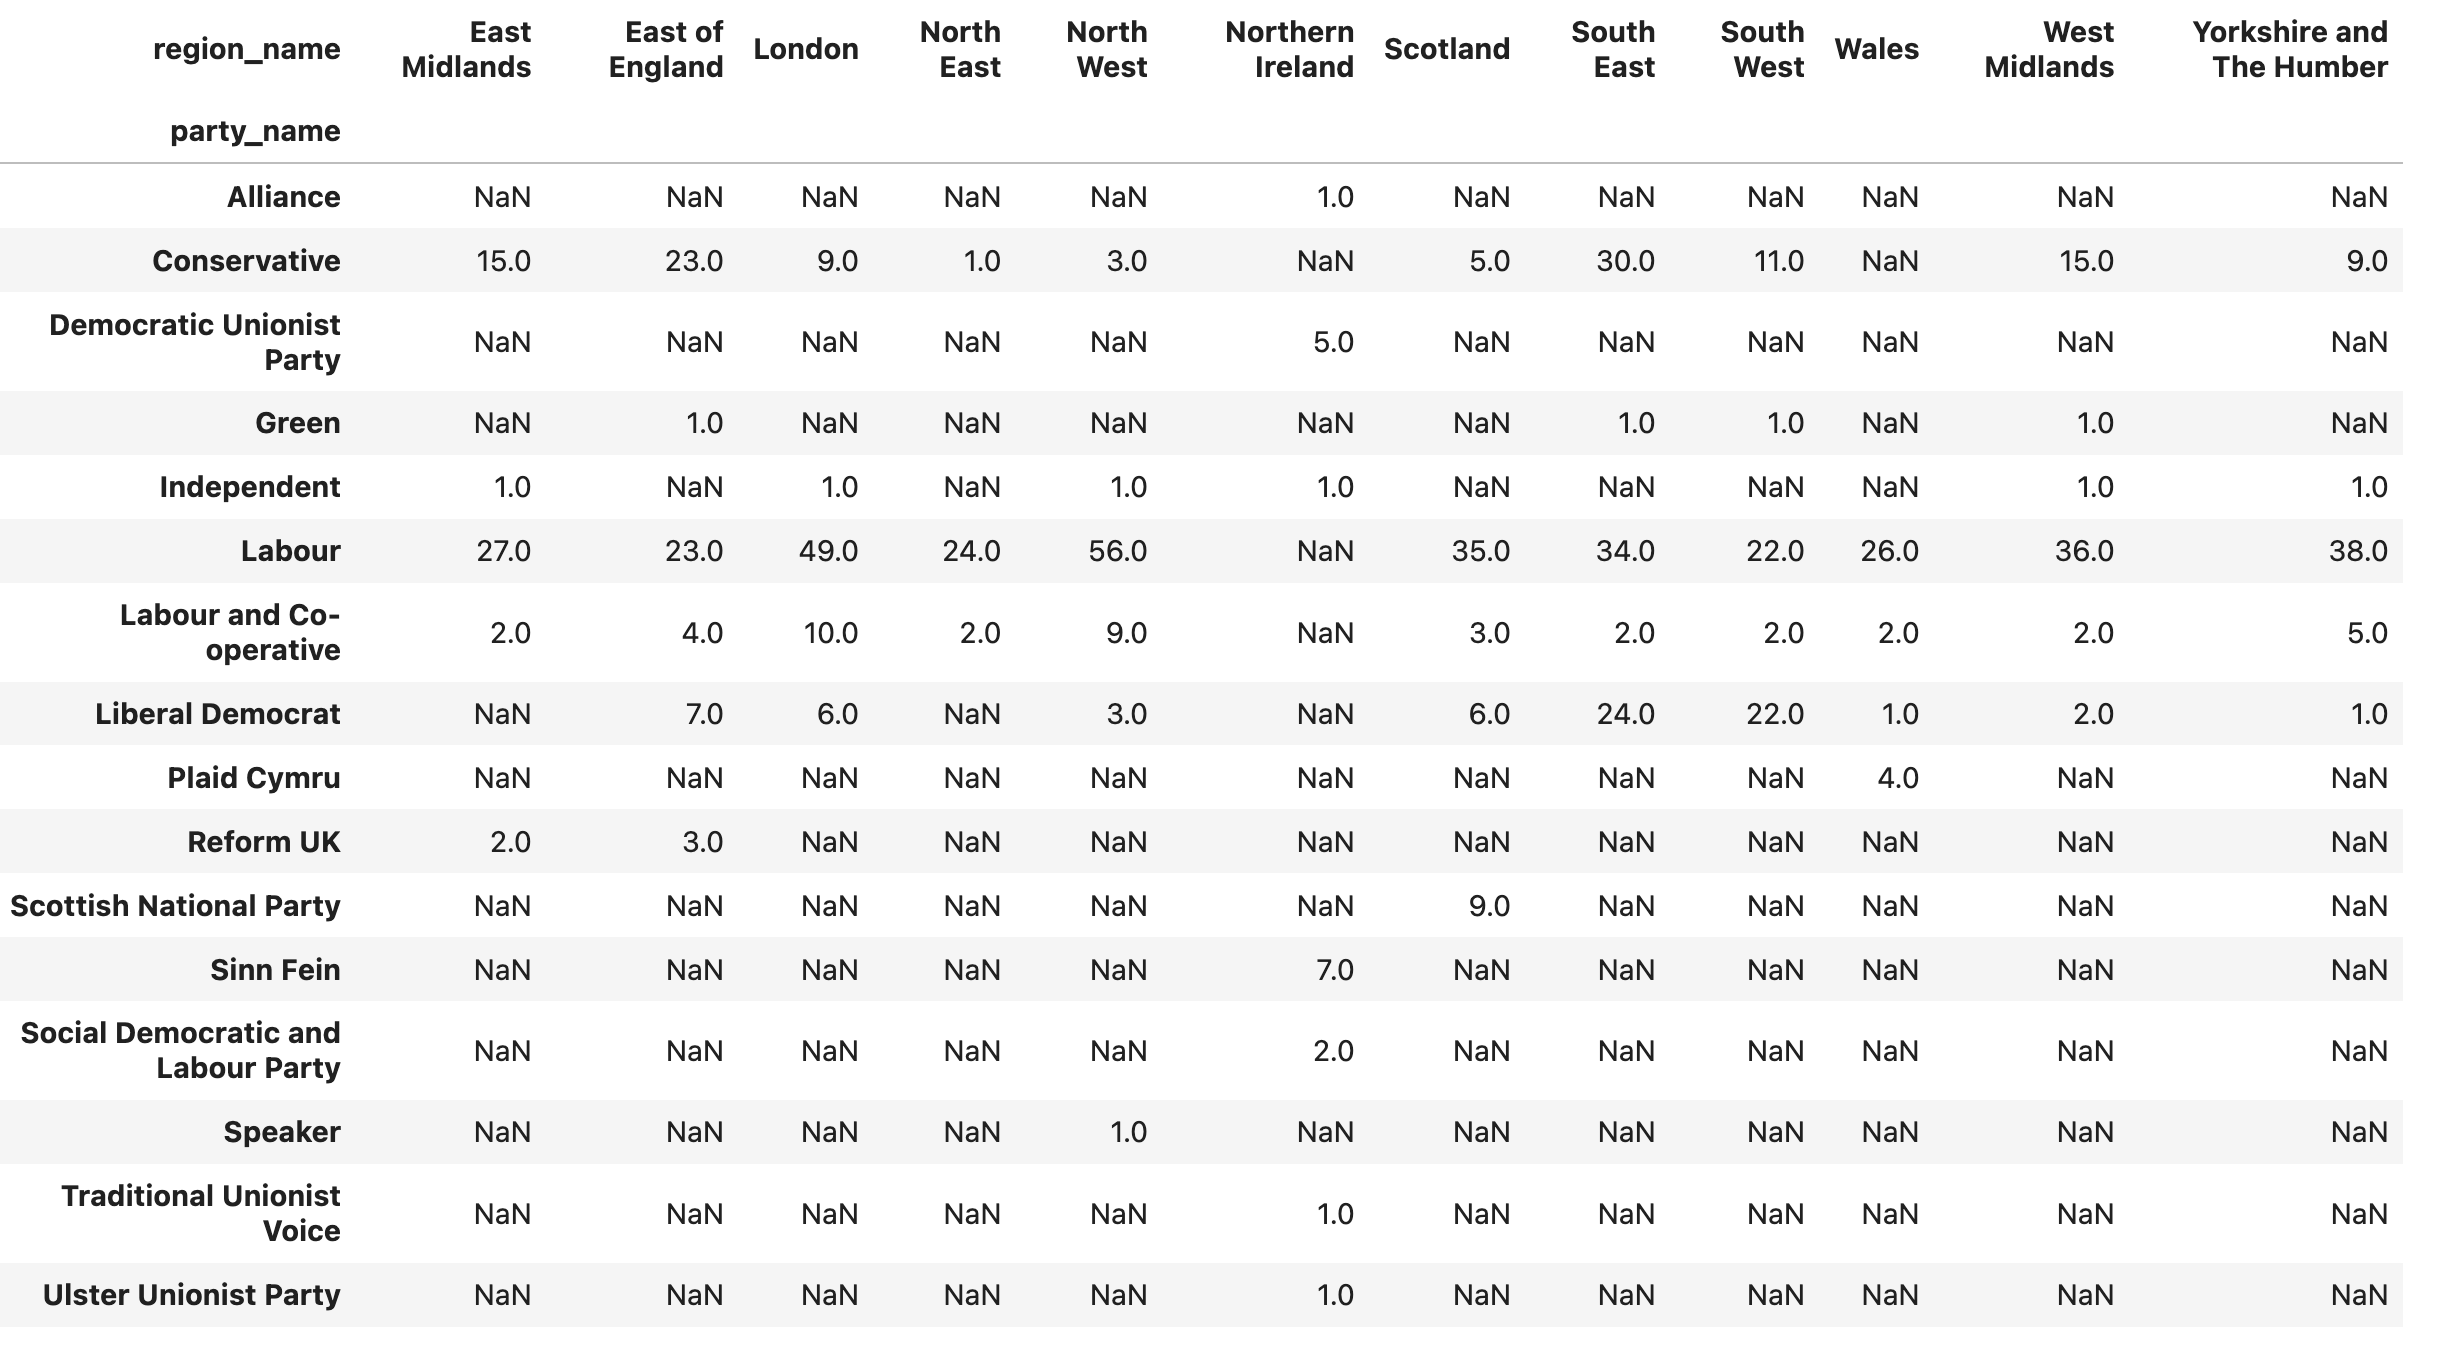
But wait a second: I didn't want to know all of the results for all of the regions. I wanted to know which party won in each region. Fortunately, I can use the idxmax method on the data frame, which will tell me, for each column (i.e. region), the index of the row with the highest value:
(
    df
    .pivot_table(index='party_name',
                 columns='region_name',
                 values='country_name',
                 aggfunc='count')
    .idxmax()
)
The result of this query is:
region_name
East Midlands                     Labour
East of England             Conservative
London                            Labour
North East                        Labour
North West                        Labour
Northern Ireland               Sinn Fein
Scotland                          Labour
South East                        Labour
South West                        Labour
Wales                             Labour
West Midlands                     Labour
Yorkshire and The Humber          Labour
dtype: object
Even without any sort of serious data analysis, we can see that in a a clear majority of regions, the Labour party really did win.
We can perform a similar calculation by using the party_name_defeated category for each constituency:
(
    df
    .pivot_table(index='party_name_defeated',
                 columns='region_name',
                 values='country_name',
                 aggfunc='count')
    .idxmax()
)
The results, as you might expect:
region_name
East Midlands                            Conservative
East of England                          Conservative
London                                   Conservative
North East                               Conservative
North West                               Conservative
Northern Ireland            Democratic Unionist Party
Scotland                      Scottish National Party
South East                               Conservative
South West                               Conservative
Wales                                    Conservative
West Midlands                            Conservative
Yorkshire and The Humber                 Conservative
dtype: object
Produce a pie chart showing how many seats were won by each political party. Use some of the traditional colors (er, colours) for the parties' pie slices: Red for Labour, blue for the Conservatives, and orange for the Liberal Democrats. You should probably choose another few colors just to make the pie chart look a bit more interesting.
Next, I asked you to create a pie chart depicting the number of seats won by each party. First, we'll need to count how many seats each party got; the easiest way to do that is is with the value_counts method:
(
    df['party_abbreviation']
    .value_counts()

)
The result:
party_abbreviation
Lab         413
Con         121
LD           72
SNP           9
SF            7
Ind           6
RUK           5
DUP           5
PC            4
Green         4
SDLP          2
Spk           1
Alliance      1
TUV           1
UUP           1
Name: count, dtype: int64
We can ask Pandas to create a pie plot by invoking plot.pie on these results. It'll sum up the numbers, and then give an appropriate pie slice for each one:
(
    df['party_abbreviation']
    .value_counts()
    .plot.pie()
)
The result:
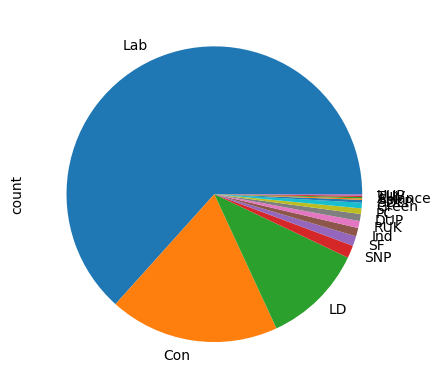
Now, this isn't wrong. But I asked you to color at least the first three parties with their traditional British political colors, namely red for Labour, blue for Conservatives, and orange for Liberal Democrat.
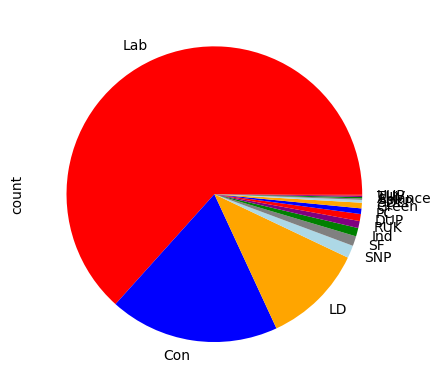
We can do that by passing a list of color names as strings to plot.pie. I added a few other colors; those chosen after the first three were completely made up by me, and were to avoid repeating the red-blue-orange colors for the rest of the pie slices:
(
    df['party_abbreviation']
    .value_counts()
    .plot.pie(colors=['red', 'blue', 'orange', 'lightblue',
                       'gray', 'green', 'purple'])
)
The result:
What is the proportion of women in the incoming parliament? In how many races did a female candidate defeat a male candidate, and vice versa?
To answer the first question, we can use value_counts on the gender column. But that'll just give us the raw numbers. If we want to know the proportion, we can pass normalize=True to value_counts, and Pandas will calculate it for us:
(
    df['gender']
    .value_counts(normalize=True)
)
The results:
gender
Male      0.595092
Female    0.404908
Name: proportion, dtype: float64
We can see that the incoming Parliament is 40 percent female.
I next asked in how many races did a female candidate beat a male candidate. We have, in each row (i.e., for each race) the gender column (for the winner) and the gender_defeated column (for the loser, if there was one). We can thus look for rows in which gender is 'Female' and gender_defeated is 'Male':
(
    ((df['gender'] == 'Female') &
     (df['gender_defeated'] == 'Male'))
)
This returns a boolean series.We could use value_counts, which will count True vs. False values, and then pull out the value for True. Or we could rely on the fact that True is 1 and False is 0, and just use sum to add them up:
(
    ((df['gender'] == 'Female') &
     (df['gender_defeated'] == 'Male'))
    .sum()
)
I checked, and using sum takes about 25% less time than the combination of value_counts and .loc.
The result, by the way? There were 59 races in which female candidates defeated male candidates.
How about the opposite? The query will be almost identical, just flipped:
(
    ((df['gender'] == 'Male') &
     (df['gender_defeated'] == 'Female'))
    .sum()
)
There were 37 such races, it turns out.
The new prime minister is Sir Keir Starmer. How many members of parliament have the title of "Sir" or "Dame", and how many of them are from each party?
Next, I asked you to find the number of MPs with the title of either "Sir" or "Dame", and to calculate how many members of each party have such titles. In other words, we'll want to get the party_name column, but only where the title column contains either 'Sir' or 'Dame'.
To do this, we'll use loc with two arguments, the row selector and the column selector. For the row selector, we'll use isin on the title column. And for the column selector, we'll simply ask for party_name. Then we can run value_counts to count up number of times each party appears:
(
    df
    .loc[
        df['title'].isin(['Sir', 'Dame']),
        'party_name']
    .value_counts()
)
The result:
party_name
Conservative               14
Labour                      7
Labour and Co-operative     2
Speaker                     1
Name: count, dtype: int64
We can see that the Conservative party has 14 such people, with Labour at 7.
Does a shorter, snappier name help someone to win an election? For races in which a sitting MP was defeated, in how many cases did the newcomer have a shorter name? (To determine which is "shorter," combine the lengths of the first, middle, and last names.)
Finally, I thought that it would be amusing to determine how often someone with a shorter name defeated someone with a longer name. This was based on nothing other than complete whimsy, along with an interest in using some more complex Pandas functionality.
So, where do we start? First, we'll keep only those rows of our data frame where there actually was a defeated candidate. This means using dropna. But if we run dropna on a data frame, we'll remove all rows with any NaN values in them. That's not what we want; there will be plenty of other column that might be NaN, even if there was a contested seat. Fortunately, we can pass the subset keyword argument to dropna, telling it which columns it should include in its assessment of whether there were NaN values.
(
    df
    .dropna(subset=['firstname_defeated'])
)
Next, because we're going to combine the lengths of first, middle, and last names, we'll need to handle the situation in which the middle name is NaN, to avoid errors from Pandas on trying to combine non-strings with strings. We can do this by using fillna, a method that replaces NaN values with anything we want. Here, we'll just replace NaN with an empty string:
(
    df
    .dropna(subset=['firstname_defeated'])
    .fillna('')
)
With those in place, we can now calculate the length of the winner's and loser's names. I'll calculate them applying str.len to each of the columns for the winner's first, middle, and last names, and also to each of the columns for the loser's first, middle, and last names. I can then create a third column, winner_has_shorter_name, a boolean indicating whether the winner has a shorter name.
This is possible with a combination of assign and lambda, and takes advantage of the fact that keyword arguments to assign are evaluated in order. So we can first create name_length, then name_length_defeated, and then winner_has_shorter_name:
(
    df
    .dropna(subset=['firstname_defeated'])
    .fillna('')
    .assign(name_length=lambda df_: (df_['firstname'].str.len() +
                                     df_['middlenames'].str.len() +
                                     df_['surname'].str.len()),
            name_length_defeated=lambda df_: (
                df_['firstname_defeated'].str.len() +
                df_['middlenames_defeated'].str.len() +
                df_['surname_defeated'].str.len()),
           winner_has_shorter_name=lambda df_: (df_['name_length'] <
                                                df_['name_length_defeated']))

)
With this in place, we can then retrieve only the column winner_has_shorter_name, and run value_counts to see how often that is true:
(
    df
    .dropna(subset=['firstname_defeated'])
    .fillna('')
    .assign(name_length=lambda df_: (df_['firstname'].str.len() +
                                     df_['middlenames'].str.len() +
                                     df_['surname'].str.len()),
            name_length_defeated=lambda df_: (
                df_['firstname_defeated'].str.len() +
                df_['middlenames_defeated'].str.len() +
                df_['surname_defeated'].str.len()),
           winner_has_shorter_name=lambda df_: (df_['name_length'] <
                                                df_['name_length_defeated']))
    ['winner_has_shorter_name']
    .value_counts()
)
The result:
winner_has_shorter_name
True     138
False     80
Name: count, dtype: int64
In other words, the winner had a shorter name 138 times (63%), and had a name of the same length 80 times (37%). Of course, the party, personality, and platform might have something to do with their ability to win, so if you have a super-short name, don't ditch your day job for politics just yet.
Here's a link to my Jupyter notebook: https://drive.google.com/file/d/1RTPHlOrbnHFzEoGoemyy-lRi6WlUDvzA/view?usp=sharing
I'll be back next week with more Pandas puzzles based on current events.
Reuven