


Three announcements:
- My new video course, "Intro to Agentic Coding with Claude Code" (https://lernerpython.com/courses/intro-agentic-coding-claude-code/) is now included in a LernerPython subscription. It reflects my almost daily use of Claude Code over the last year, and is the first of many agentic coding classes I'll be adding to the LernerPython site in the near future.
- We'll hold Pandas office hours on Sunday, November 15th, open to paid subscribers and LernerPython+data members. I'll send Zoom info tomorrow. Come with your data-related questions, or just to hang out with other Python-and-data people.
- Earlier today, I announced my newest service, "Vibe to Valid," in which I review a vibe-coded application and tell you where it could use some help — or even fix it up for you. More details at https://VibeToValid.com.
Today, just about everyone turns to AI to get solutions to programming problems. But for the better part of two decades, Stack Overflow dominated that space, with thousands of questions on hundreds of topics.
However, that's no longer the case; an article from January (https://www.devclass.com/ai-ml/2026/01/05/dramatic-drop-in-stack-overflow-questions-as-devs-look-elsewhere-for-help/4079575) described the decline in new questions, which undoubtedly reflects the number of people who are visiting the site, too.
This week, we looked at data about Stack Overflow, as provided by Stack Overflow itself, in its data-query facility. The numbers we saw just confirmed the decline of the site, yet another casualty (alongside Jensen Huang, you could say) of the AI revolution.
Data and five questions
This week's comes from the Stack Exchange data explorer, where "Stack Exchange" is the umbrella site for Stack Overflow and many other community-powered question-and-answer sites. You can enter your own queries using SQL, or you rerun queries that were created and named by other users, at https://data.stackexchange.com/stackoverflow/queries .
Quite frankly, I didn't spend time reviewing their schema; I simply asked Claude Code to create queries for me. With a bit of effort, I probably would have discovered queries that matched my own and were already in their database.
For each question, I've specified which query I used to get the data, via URL. You can use that URL anonymously, but you'll need to solve a CAPTCHA to use it and then to download the data in CSV format.
Paid subscribers, both to Bamboo Weekly and to my LernerPython+data membership program (https://LernerPython.com) get all of the questions and answers, as well as downloadable data files, downloadable versions of my notebooks, one-click access to my notebooks, and invitations to monthly office hours.
Learning goals for this week include: Working with CSV files, dates and times, grouping, and plotting with Plotly.
Here are the solutions and explanations for this week's five questions:
How many new questions have been posed each week over the course of Stack Overflow's life? Use query https://data.stackexchange.com/stackoverflow/query/1926661 . Create a line plot with this data. On which date did Stack Overflow have its greatest number of questions? Was that before, after, or about the same time as Stack Overflow was bought in June 2021?
As usual, I started off by importing both Pandas as Plotly:
import pandas as pd
from plotly import express as px
I then put the answers to the first query in a file, and loaded it into a data frame using read_csv:
df1 = pd.read_csv('data/bw-196-q1.csv',
                 parse_dates=['Month'])
Notice that I had to pass the parse_dates keyword argument in order to set the Month column as a datetime value. My instinct is normally to turn such a column into the data frame's index, but I needed it in a regular column, and thus kept it there.
The resulting data frame contained 221 rows and 2 columns.
I then created a line plot: I used pipe to invoke px.line as part of a method chain (not that the chain was very long!), indicating that the x axis should be Month, and the y axis should be Questions, meaning the number of questions
(
    df1
    .pipe(px.line, x='Month', y='Questions')
)
You can see the plot here:
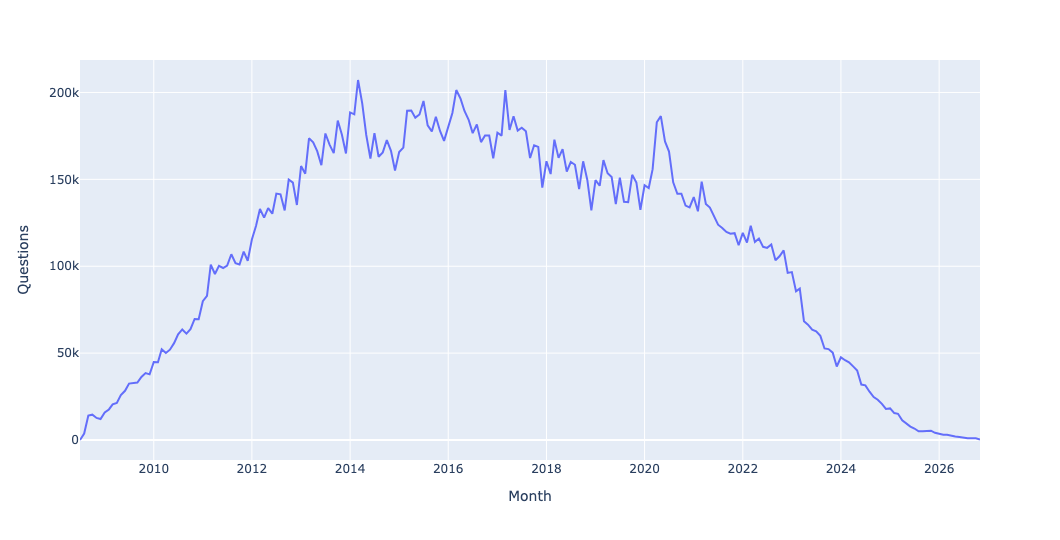
ChatGPT was released about four years ago, in November 2022. Notice, starting around then, how dramatically the numbers dropped. However, we can see that the numbers were dropping, if more slowly, before then. I thus asked when Stack Overflow reached its maximum, and what that level was.
Here, I used set_index to make Month the index. Then I used agg to perform two calculations, both max (getting the maximum value from the one remaining column) and idxmax (getting the index associated with that maximum value):
(
    df1
    .set_index('Month')
    .agg(['max', 'idxmax'])
)
The query told me that March of 2014 was the high point, with 207,169 questions asked. I'm not sure why things declined from there, although we can see from the plot that it stayed in the same ballpark for quite some time.
Whether the site declined because of poor answers (and they definitely existed) or the harsh rules for who could answer questions or edit existing answers (which turned off a lot of people), or just other sites opening up – but it still looks like, with the exception of the covid-19 pandemic in 2020, that things started to decline a bit before, with an even steeper one after.
The sale of Stack Overflow in 2021 seemed to come after that covid-19 spike, but I'm not sure if there was any relationship between the two.
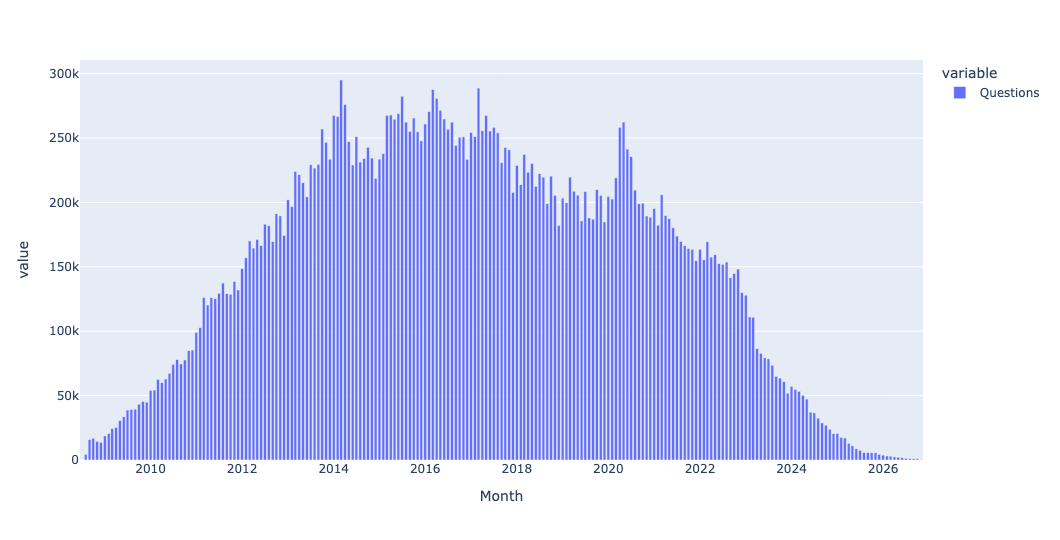
You can get the frequency of the top 100 tags on Stack Overflow for each month at https://data.stackexchange.com/stackoverflow/query/1982380/tag-count-by-month . Read it into a data frame. Looking just at these tags, how many were applied to questions in each month? Create a bar plot with this info. What were the 5 most popular tags in Stack Overflow's first 3 years? What about the most recent 3 years?
I again used read_csv to read the second file into a Pandas data frame. Once again, I passed parse_dates to turn the Month column into datetime values:
df2 = pd.read_csv('data/bw-196-q2.csv',
                 parse_dates=['Month'])
How many tags were applied to questions in each month? This requires taking all of the tag numbers for each month and summing them together – a classic use of groupby:
(
    df2
    .groupby('Month')['Questions'].sum()
)
It might seem like this would give us the same results as the number of questions. But that's not the case, because a single question can have multiple tags. (If I had thought about it when composing these questions, I would have asked you to join the two data sets together, and find the mean and median number of tags per question in each week.)
Once again, we can use groupby, handing its output to pipe and px.bar:
(
    df2
    .groupby('Month')['Questions'].sum()
    .pipe(px.bar)
)
The result:
In order to find the most popular tags in the first three years, I first used pivot_table to get a data frame in which the rows were the dates (months), and the columns were all of the tag names. With that in place, I could use iloc[:36] to get the first 36 months (i.e., 3 years) for which we have data. I then invoked sum on the result, giving me a series indicating the total number of times each tag was used. Running nlargest(5) gave me the five most popular ones:
(
    df2
    .pivot_table(index='Month',
                 columns='TagName',
                 values='Questions')
    .iloc[:36]
    .sum()
    .nlargest(5)
)
The results:
TagName	value
c#	183500.0
java	128260.0
php	117869.0
javascript	104277.0
jquery	89840.0
What about the final three years? I did the same thing, but the opposite values for iloc, starting with the -36 position:
(
    df2
    .pivot_table(index='Month',
                 columns='TagName',
                 values='Questions')
    .iloc[-36:]
    .sum()
    .nlargest(5)
)
The results:
TagName	value
python	72495.0
javascript	40077.0
c#	29955.0
java	26848.0
reactjs	21852.0
Wow, that's quite a change! Python wasn't even on the board in the first three years, and it dominated by quite a lot in the final three years. JavaScript moved up quite a bit, but notice that whereas jQuery (a then-popular JavaScript library) was in the top 5 in the earliest years, it was replaced by ReactJS in later years. Java and C# both had staying power, though.