


This week, as I was recovering from PyCon US in Pittsburgh, I thought it might be interesting to look into Python conferences. There are lots of these events, and the number just seems to be growing – which is great, because I really enjoy attending them, and you'll likely enjoy attending them, too.
While the data set that I found described many of them and gave specific dates, the Python wiki has a full page dedicated to conferences (https://wiki.python.org/moin/PythonConferences). And that doesn't even include all of the PyData conferences (https://pydata.org/), as well as user-group meetings. I even just found a site that lists conferences and the dates by which you need to submit proposals for giving a talk: https://pythondeadlin.es/
Data and five questions
This week's data comes from the following Git repository:
https://github.com/python-organizers/conferences
This repo, organized by a number of community volunteers, contains a number of CSV files, each representing conferences held in a particular year.
Learning goals for this week include working with multiple CSV files, dates and times, grouping, and plotting.
If you're a paid subscriber, then you'll be able to download the data directly from a link at the bottom of this post, download my Jupyter notebook, and click on a single link that loads the notebook and the data Google Colab.
Also: Because I'm away from home, I didn't get a chance to do a YouTube video solving the first two questions this week. (I hope to do it next week, when I'm back home.) But there are lots of other Bamboo Weekly videos at https://www.youtube.com/playlist?list=PLbFHh-ZjYFwG34oZY24fSvFtOZT6OdIFm !
Meanwhile, here are my five tasks and questions:
Download the GitHub repo for conferences. Read the CSV files for each of the years in the repo into a single data frame. Make sure that all of the date-related columns are datetime dtypes.
Before doing anything else, let's set up Pandas:
import pandas as pd
Next, the data comes not from one CSV file, but from a number of them. This means that we'll need to read a number of files into Pandas using read_csv, and then combine them into a single data frame using pd.concat. How can we do that most easily?
My favorite technique is to use a list comprehension, iterating over the names of the CSV files we'll want to hand to read_csv. In other words, we'll want to do something like this:
all_dfs = [pd.read_csv(one_filename)
           for one_filename in list_of_filenames]
But of course, the above code assumes that list_of_filenames has already been defined. How can I create it?
One option is to use os.listdir. But I've never really liked this function, because it doesn't let you specify a pattern. Rather, it returns a list of all files in a directory, including subdirectories. And if you only want the CSV files, then you'll need to filter the results.
For that reason, I like to use glob.glob, also in Python's standard library. You can invoke glob with a pattern much like on the Unix command line, such as '*.csv'. Moreover, while it returns a list of strings (like os.listdir), each string is a complete pathname, rather than just the filename. Which means that you don't need to assemble the path or use os.path.join to use it.
If you're a fan of pathlib, then you could use that instead, since there's a glob method on every pathlib.Path object.
Here's an updated version of my query, using glob.glob:
all_dfs = [pd.read_csv(one_filename)
           for one_filename in glob.glob('data/bw-119-conferences/*.csv')]
This works, returning a list of data frames in all_dfs. However, I asked you to ensure that all of the date-related columns will be treated as datetime values. In order to guarantee that this happens, we need to pass the parse_dates keyword argument, giving it a list of strings (i.e., column names) that we want to be turned into datetime values:
all_dfs = [pd.read_csv(one_filename,
                      parse_dates=['Start Date', 'End Date',
                                  'Tutorial Deadline',
                                  'Talk Deadline'])
           for one_filename in glob.glob('data/bw-119-conferences/*.csv')]
With this list in place, we can then combine all of its elements into a single data frame:
df = pd.concat(all_dfs)The result is a small data frame, with 404 rows and 11 columns, describing a number of Python conferences from 2017 through 2026.
How many Python conferences are listed for each year? Create a bar plot visualizing this information. Does anything stick out? Find, starting in 2020, the 10 countries with the greatest number of total conferences. Create a bar plot comparing their numbers.
Finding the number of conferences each year sounds like a grouping problem: We want to take a categorical column, and for each of the unique values it contains, we'll perform a calculation on another column.
In this case, we'll take each of the years in the Start Date column, pass them to groupby, and we'll count the number of rows (using the Subject column).
But wait: How can we get the years, given datetime values? The most straightforward way is with the dt accessor, which retrieves a piece of the datetime value. If we say dt.year, then we get the year portion of the datetime. And yes, we can even group on these values. Meaning, we can say:
(
    df
    .groupby(df['Start Date'].dt.year)['Subject'].count()
)
Notice, in the above query, that we're not grouping on the Start Date column, but rather on a portion (the year portion) of the Start Date column. We then use count to count the number of rows in the Subject column for each year.
That gives me the following result:
Start Date
2017    40
2018    58
2019    50
2020    36
2021    13
2022    25
2023    71
2024    67
2025    43
2026     1
Name: Subject, dtype: int64
Notice that we get a series back; the index contains the unique years in our datetime column, and the values are the counts. Also notice that the index is sorted in ascending order.
But I didn't ask for the numbers. Rather, I asked for a bar plot. And we can get that by invoking plot.bar:
(
    df
    .groupby(df['Start Date'].dt.year)['Subject'].count()
    .plot.bar()
)
Here's what I get:
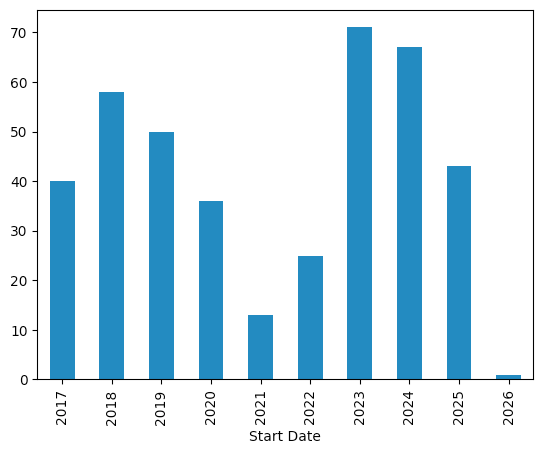
As for what sticks out, we can see that 2021 had a very small number of conferences – I'm guessing that in 2020, many took place before covid lockdowns, or were counted as taking place even if they were online. 2022 was a bit better, and 2023 represented what I heard referred to as "revenge travel," when everyone wanted to go away.
I then asked you to find, starting in 2020, the 10 countries with the greatest number of total conferences.
Like the previous question, this is also a grouping problem, but before we can invoke groupby, we need to ensure that we're only counting conferences in 2020 and beyond.
There are a few ways to do that, but my favorite way is a combination of loc and lambda: We pass loc a function (with lambda) that takes a data frame as an argument (which we assign to df_) to which we apply our condition. If the function returns True, then the corresponding row is returned, having passed the filter. If the function returns False, then the row isn't returned. Here's how the query looks:
(
    df
    .loc[lambda df_: df_['Start Date'].dt.year >= 2020]
)
The result is a new data frame, a subset of df, in which all of the conferences are from 2020 or later.
Now we want to perform our groupby operation – but we can't use df to retrieve the year, because we aren't operating on df any more, but rather on a subset of it. Trying to run groupby on df will give us an error.
The solution is to use pd.Grouper, a special Pandas object designed for precisely this sort of use case, where we want to group, but we don't have the data frame on which we want to perform the grouping. We can just invoke pd.Grouper(key='Country'), and this will effectively run groupby('Country'):
(
    df
    .loc[lambda df_: df_['Start Date'].dt.year >= 2020]
    .groupby(pd.Grouper(key='Country'))['Subject'].count()
)
Now that we know how many conferences took place in each country, we can invoke sort_values to get them in increasing order, then tail(10) to get the 10 countries with the most conferences:
(
    df
    .loc[lambda df_: df_['Start Date'].dt.year >= 2020]
    .groupby(pd.Grouper(key='Country'))['Subject'].count()
    .sort_values()
    .tail(10)
)
Finally, I asked you to create a bar plot from these, which we can (again) do with plot.bar:
(
    df
    .loc[lambda df_: df_['Start Date'].dt.year >= 2020]
    .groupby(pd.Grouper(key='Country'))['Subject'].count()
    .sort_values()
    .tail(10)
    .plot.bar()
)
Here is the final answer:
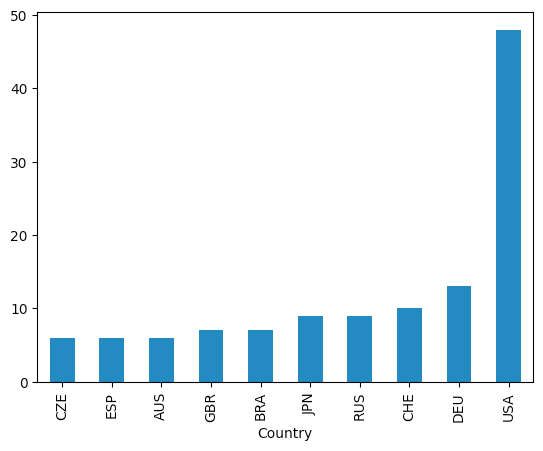
Not surprisingly, the United States has held the greatest number of Python conferences since 2020. (I say "not surprisingly," because it's a huge country with many regional Python conferences.)
I'm not surprised by the large number in Germany (DEU), but there were a bunch in Switzerland, in Russia (I didn't expect that), Japan (not surprising), and Brazil (not surprising). I guess my only surprise here is that the UK came so far behind, but that might reflect the data set, rather than the actual number of conferences.