


[Administrative note: If you learned Python years ago, then you might not even know how much Python has changed, and what techniques you're missing out on . My upcoming 8-hour "python --update" course will help you understand everything from structured pattern matching to asyncio, it is free to LernerPython members. For more info, go to https://LernerPython.com/python-update.]
I'm in Krakow, Poland for the EuroPython conference, an amazing annual conference that I have been attending (and speaking at) since 2019. I'm spending most of my time today attending talks, although I'll also be chairing a session or two. I've already learned quite a bit, and look forward to sharing much of these ideas during my LernerPython office hours in August.
Meanwhile, I've been exploring Krakow a bit, and I'm not alone – there are oodles of tourists all over, especially in the old town where I'm staying. I thought it would be interesting to explore hospitality and tourism data about Poland in general, and Krakow in particular.
Data and four questions
The Polish government, like many other democracies, makes their data available to the public via a Web portal at https://bdl.stat.gov.pl/bdl/start . If your Polish isn't so hot, you can click on the UK flag toward the top right to get an English-language version of the portal. Click on "data by areas," and on the new page, click on "tourism." This week's data comes from two parts of the portal:
- First, we'll look at occupancy rates of facilities in Malopolska ("Lesser Poland"), the region in which Krakow is the largest city and capital. Choose "occupancy rate of bed places by type of facilities," also known as parameter P2366. Choose all types and all years in Malopolska, and download the values in zipped CSV.
- Then, we'll look at tourists on a monthly basis. That's still under the tourism info, but under the group "tourist accommodation establishments (monthly data)," and the subgroup, "occupancy in tourist establishments by month". I chose years 2019-2026, all months, hotels, and total tourists – and again, only Malopolska.
I had originally hoped to do some joins across different data sets, but I had a few constraints: (1) some data is monthly, and other data is annual, (2) the data is handled at different levels of geographic granularity, (3) the data is released on different schedules, and (4) let's be honest, I'm quite busy at EuroPython! So instead, I asked you two questions based on the first data set, and two more questions on the second one.
Paid subscribers, both to Bamboo Weekly and to my LernerPython+data membership program (https://LernerPython.com) get all of the questions and answers, as well as downloadable data files, downloadable versions of my notebooks, one-click access to my notebooks, and invitations to monthly office hours.
Learning goals for this week include grouping, pivot tables, plotting, dates and times, and regular expressions.
Here are my four questions for this week, with my solutions and explanations:
Read the P2366 data (percentage occupancy, per year, of each type of facility) into a Pandas data frame, ignoring the empty columns. Which type of facility has the highest mean occupancy rate? What type of facility, in 2025 (the most recent year for which they provide data) was the highest? In 2025, which types of facilities had surpassed their percentage occupancy level in 2019, before the covid-19 pandemic?
I started by loading Pandas and Plotly:
import pandas as pd
from plotly import express as px
I then wanted to load the data file into a CSV file. The usual way to do that is with read_csv, and I wanted to that here, too.
I found that reading the data without any arguments gave me a single column, with values squished together. That's because these files use ; (semicolon) characters to separate fields. I'm guessing that this is because Poland typically uses a comma for decimals (as opposed to periods, as done in many other countries). I thus passed the sep keyword argument to read_csv. That gave me the columns I wanted.
I found that I had two empty fields at the end of my data frame – one because of a trailing ; on each line, and the second because there were no values there. I solved this by passing the usecols keyword argument. I originally solved this by passing range(6), giving the integer indexes of the columns. But then I decided that I only needed three of the columns, and just used [] to retrieve those from the entire data frame:
p2366_filename = 'data/bw-179-p2366.csv'

p2366_df = (
    pd
    .read_csv(p2366_filename, sep=';')
    [['Types of facilities', 'Year', 'Value']]
)
The result was a data frame of 576 rows and 3 columns.
Which type of facility has the highest mean occupancy rate? I found that with groupby:
(
    p2366_df
    .groupby('Types of facilities')['Value'].mean()
)
Remember that groupby takes a categorical (here 'Types of facilities') and executes an aggregation method (here, mean) on each of the distinct values in the categorical. That gave the answer I wanted, but I also wanted to know which types had the highest and lowest occupancy rates. For that, I used sort_values:
(
    p2366_df
    .groupby('Types of facilities')['Value'].mean()
    .sort_values(ascending=False)
)
The result:
Types of facilities	Value
health establishments	72.6129166667
hotels	43.285
hostels	42.9570588235
hotels and similar establishments	41.6025
total	37.755
boarding houses	34.66125
creative arts centres	34.1025
other tourist accommodation establishments	33.6475
youth hostels	33.0558333333
other hotel establishments	32.9945454545
training-recreational centres	32.5195833333
shelters	30.6325
holiday centres	30.3354166667
complexes of tourist cottages	30.10875
motels	28.0991666667
holiday youth centres	26.92625
other not classified facilities	26.7191666667
weekend and holiday recreational centres	26.67
school youth hostels	21.515
private rooms for rent	20.75
excursion hotels	20.09375
tent camp sites	19.87875
camping sites	17.9366666667
agrotourism lodgings	11.52
Notice that "health establishments" had a 72.6 percent occupancy rate overall. But does that mean ... hospitals? No, it turns out that it refers to spas and similar places, which are not surprisingly quite popular. Next up are hotels and hostels, with about the same (42-43 percent) occupancy rate.
Next, I asked What type of facility, in 2025 (the most recent year for which they provide data) was the highest? I first used loc to filter the data frame. I actually used the two-argument version of loc:
- For the row selector, I used
pd.col,comparing it with 2025 - For the column selector, I passed two columns
I then used sort_values on the resulting data frame, asking to get the results in descending order by Value:
(
    p2366_df
    .loc[pd.col('Year') == 2025,
        ['Types of facilities', 'Value']]
    .sort_values('Value', ascending=False)
)
The results for 2025 were similar to what we saw above, when getting the mean across all years:
	Types of facilities	Value
527	health establishments	78.3
71	hotels	52.7
47	hotels and similar establishments	50.5
479	hostels	49
23	total	43.8
143	other hotel establishments	43.5
215	shelters	42
359	creative arts centres	35.8
239	youth hostels	35.4
335	training-recreational centres	35
167	other tourist accommodation establishments	34.9
119	boarding houses	33
287	holiday centres	31.5
407	camping sites	27.6
551	other not classified facilities	27.4
575	private rooms for rent	27.4
383	complexes of tourist cottages	27.3
95	motels	25.9
311	holiday youth centres	25.5
431	tent camp sites	20
263	school youth hostels	19.6
191	excursion hotels	17.2
503	agrotourism lodgings	12.8
455	weekend and holiday recreational centres
We can see that spas have always been extremely popular, both last year and overall – followed (again) by hotels and hostels.
Finally, I asked which types of facilities had surpassed their percentage occupancy level in 2021, during the covid-19 pandemic.
This required somehow taking the 2019 and 2025 data for each type of facility, and figuring out which were higher and which were lower.
To do this, I started with loc , again with two arguments:
- The first argument, the row descriptor, used
pd.colwithYear, as before. But this time, I wanted to allow for either of two years, so I usedisinalong with a two-element list of integers. - The second argument, the column descriptor, was a list of three columns (probably unnecessary, since I had cut it down already).
Then, with just these rows and columns, I needed to rejigger things. For that, I used pivot_table, which allowed me to reshape our data with the facility types in the index, and the years in the columns:
(
    p2366_df
    .loc[pd.col('Year').isin([2019, 2025]),
        ['Types of facilities', 'Value', 'Year']]
    .pivot_table(index='Types of facilities',
                columns='Year',
                values='Value')
)
This allowed me to see the occupancy rates for each type of facility just before the pandemic (in 2019) and then in the most recent year (2025). I can compare them with my eyes, but that's not really what we want.
I thus used assign to create a new column, higher_now, with a boolean value based on calculating pd.col(2025) > pd.col(2019).
I ran value_counts on higher_now, and found that 13 places have not reached their pre-pandemic occupancy levels, but 10 have. We had 24 types altogether, and the 24th had NaN for 2025, so we couldn't compare it.
For a fuller set of answers, I grabbed higher_now and ran sort_values:
(
    p2366_df
    .loc[pd.col('Year').isin([2019, 2025]),
        ['Types of facilities', 'Value', 'Year']]
    .pivot_table(index='Types of facilities',
                columns='Year',
                values='Value')
    .assign(higher_now = pd.col(2025) > pd.col(2019))
    ['higher_now']
    .sort_values()
)
Because the sorting was ascending, this put all of the False columns first, and then the True columns (since booleans inherit from Python integers 0 and 1). The results:
Types of facilities	higher_now
agrotourism lodgings	false
boarding houses	false
complexes of tourist cottages	false
tent camp sites	false
excursion hotels	false
health establishments	false
holiday youth centres	false
hostels	false
school youth hostels	false
training-recreational centres	false
motels	false
other not classified facilities	false
other tourist accommodation establishments	false
total	true
shelters	true
private rooms for rent	true
hotels and similar establishments	true
hotels	true
holiday centres	true
creative arts centres	true
camping sites	true
other hotel establishments	true
youth hostels	true
So we see (among other things) that hotels and youth hostels are doing well, but health establishments and tent campsites haven't.
Create a line plot, showing the percentage occupancy rate in each year, for each type of facility with "otel" or "ostel" in its description. During the pandemic (2020 and 2021), which types of facility did the best?
First and foremost: I started by using pivot_table to reorganize the data with years in the index (the rows) and the types of facilities in the columns. I did that because if you create a line plot on a data frame, the x axis is set via the index, with a different line created for each column:
(
    p2366_df
    .pivot_table(
        index='Year'        ,
        columns='Types of facilities',
        values='Value'
    )
)
That's great, but I'm not really interested in all of the columns. Rather, I only want those with "otel" or "ostel" in the name. How can I do that?
The answer in Pandas is to use the filter method, which lets us specify a regular expression. We'll then get back only those columns that match the regexp. Here, I specified 'os?tel'. Because ? in a regexp means "the previous character is optional," this found both "ostel" and "otel" columns.
Finally, I used pipe to let me invoke px.line, a Plotly function, as a method on our data frame:
(
    p2366_df
    .pivot_table(
        index='Year'        ,
        columns='Types of facilities',
        values='Value'
    )
    .filter(regex='os?tel', axis='columns')
    .pipe(px.line)
)
The result:
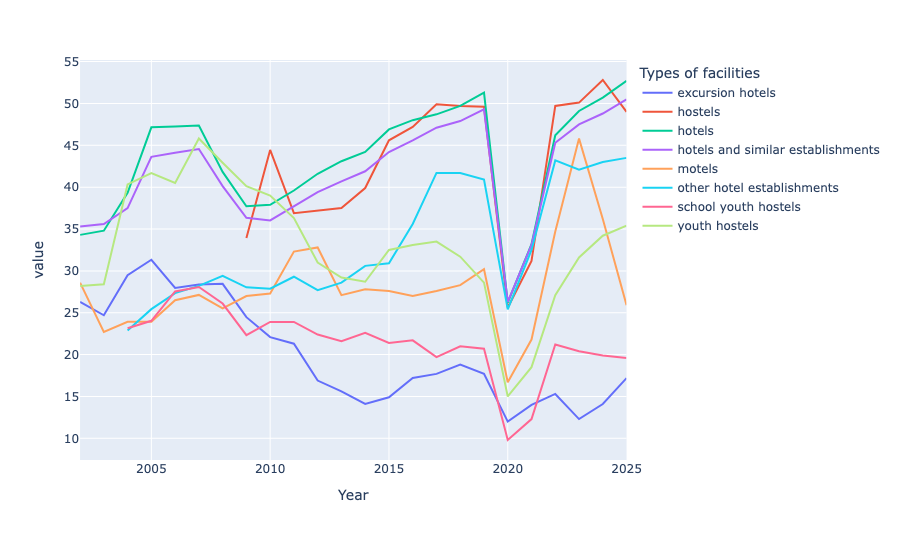
We can see that we have indeed filtered the column names pretty nicely, keeping only hotels/motels/hostels. We can also see that there are wildly different percentages of occupancy, ranging from very low (15 percent or so) to fairly high (50 percent or so).
What if we want to zoom in on just the pandemic years, 2020 and 2021? To find out, I first used .loc and pd.col along with isin to keep just 2020 and 2021 data. Then I ran the same pivot_table query as before. But then, since I wanted to view and compare things, I needed to transpose the data (with T, an alias for transpose). I then used sort_values to sort them for easier viewing:
(
    p2366_df
    .loc[pd.col('Year').isin([2020, 2021])]
    .pivot_table(
        index='Year'        ,
        columns='Types of facilities',
        values='Value'
    )
    .filter(regex='os?tel', axis='columns')
    .T
    .sort_values(2020)
)
The results:
2020	2021	Types of facilities
9.8	12.3	school youth hostels
12	14	excursion hotels
15	18.5	youth hostels
16.7	21.8	motels
25.4	32.5	other hotel establishments
25.6	31.2	hostels
26.2	33.2	hotels
26.3	33.1	hotels and similar establishments
Looks like hotels still did OK – not amazingly, but OK – during the pandemic years. That's better than some other facilities, such as school youth hostels, presumably because schools weren't in session.