


This week, we’re looking at data about labor unions in the United States. Specifically, we’re looking at data that was originally collected by the Bureau of Labor Statistics, then assembled at UnionStats.com, a site set up by three labor economists (Barry T. Hirsch, David A. Macpherson, and William E. Even).

Data and 10 questions
The Unionstats site offers data in a few different formats, the most of useful of which (to us, at least) is Excel. I presented ten questions and tasks having to do with union membership and earnings, and asked you to answer them using the files on Unionstats.com:
First, let's look at union membership per industry. Read in the data for union membership across industries in 2022 from from http://unionstats.com/ind/xls/ind_2022.xlsx, on the page http://unionstats.com/ind/ind_index.html.
I started off, as usual, by importing the Pandas library:
import pandas as pdWith that in place, I can now download the Excel file using read_excel. When you first start to use Pandas, it might seem like you need to manually download a file and then import it from the local filesystem. But if the file isn’t too big, then you can just give read_excel a URL:
url = 'http://unionstats.com/ind/xls/ind_2022.xlsx'
df = pd.read_excel(url)
That does work, in the sense that it creates a data frame. But it doesn’t really work in a useful way. That’s because the Excel file, as constructed, has a descriptive line at the top (above the column names). It also has copyright and attribution information at the bottom, in line 287 of the spreadsheet.
Since the headers are on line 3 of the Excel file, we’ll tell Pandas to read them using the “header” keyword argument to read_excel. But remember that while Excel starts numbering with 1, Pandas starts with 0. Thus, we’ll tell it that the headers are on line 2:
url = 'http://unionstats.com/ind/xls/ind_2022.xlsx'
df = (
    pd.read_excel(url, header=2)
)
Finally, we’ll remove line 283 of the data frame, which contains the copyright information. Having it there will interfere with things:
url = 'http://unionstats.com/ind/xls/ind_2022.xlsx'
df = (
    pd.read_excel(url, header=2)
    .drop(283)
)
We end up with a data frame whose rows describe the different types of jobs that people had in 2022 — both overall categories (in ALL CAPS) and more specific sub-categories. For each of these, we get the number of observations (i.e., people who were interviewed), the number of people employed in this area, the number of union members, the number of people who are covered by a union contract even if they aren’t themselves union members, the percentage of people who are members, and the percentage of covered non-members.
With our data frame in place, we can now start to perform some calculations with our data.
Looking only at the rows containing top-level job categories (where all of the words are capitalized): Which five categories have the highest union membership? The lowest?
If we want to find the five job types with the highest percentage of union membership, we could just run sort_values on our data frame, and take the top five. But that’s not quite what I asked for: I wanted to know what the top five were among the top-level categories.
Fortunately, we know that top-level categories are in ALL CAPS. Thus, I just need to retrieve the rows from the data frame whose words are in ALL CAPS. An easy way to do this is to turn each element of the “Industry” column into all caps; if that is equal to the original value, then it was in all caps to begin with, and we’ll keep it.
The Python string class has an “upper” method, which can be applied to a single string. We can apply that same method to every element of our series via the “str” accessor. In other words, if we invoke “str.upper()” on a column, we’ll get back a new series containing the same values, but in all caps.
df['Industry'].str.upper()Now we can run a comparison between the original values and the all-caps values:
df['Industry'] == df['Industry'].str.upper()This returns a boolean series (i.e., one containing True/False values), of the same length and with the same index as our data frame, df. We can then apply this boolean series as a mask index on df, using df.loc:
df.loc[df['Industry'] == df['Industry'].str.upper()]This will return only those rows of df that are high-level categories. How can we then sort these lines by the percentage of union members? Now we can use sort_values, telling it ascending=False (i.e., we want in descending order), then using “head” to get only the first five values:
df.loc[df['Industry'] == df['Industry'].str.upper()].sort_values('% Mem', ascending=False).head(5)But wait: If we only are about the industry and percentage of membership, let’s pass a second argument to “loc” indicating that we only want those two columns:
df.loc[df['Industry'] == df['Industry'].str.upper(),
  ['Industry', '% Mem']
].sort_values('% Mem', ascending=False).head(5)
The result is a five-element, two-column data frame:
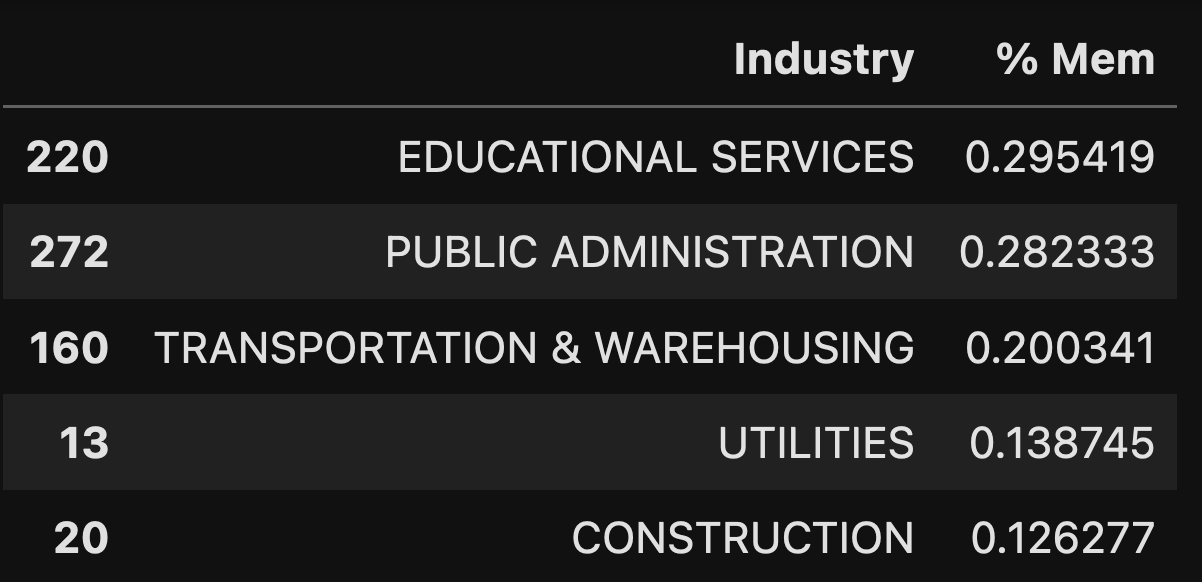
In 2022, we can see that nearly 30 percent of people in education and public administration are unionized — not surprising, given the prevalence of teacher and public-sector unions in the United States. Further down are transportation and warehousing, which makes me think of UPS, but I’m sure that there are many more types of businesses here. Finally, we have utilities and construction.
How can we find the industries with the lowest percentage of union membership in 2022? Just reverse the sort that we did:
df.loc[df['Industry'] == df['Industry'].str.upper(),
  ['Industry', '% Mem']
].sort_values('% Mem', ascending=True).head(5)
And the results:
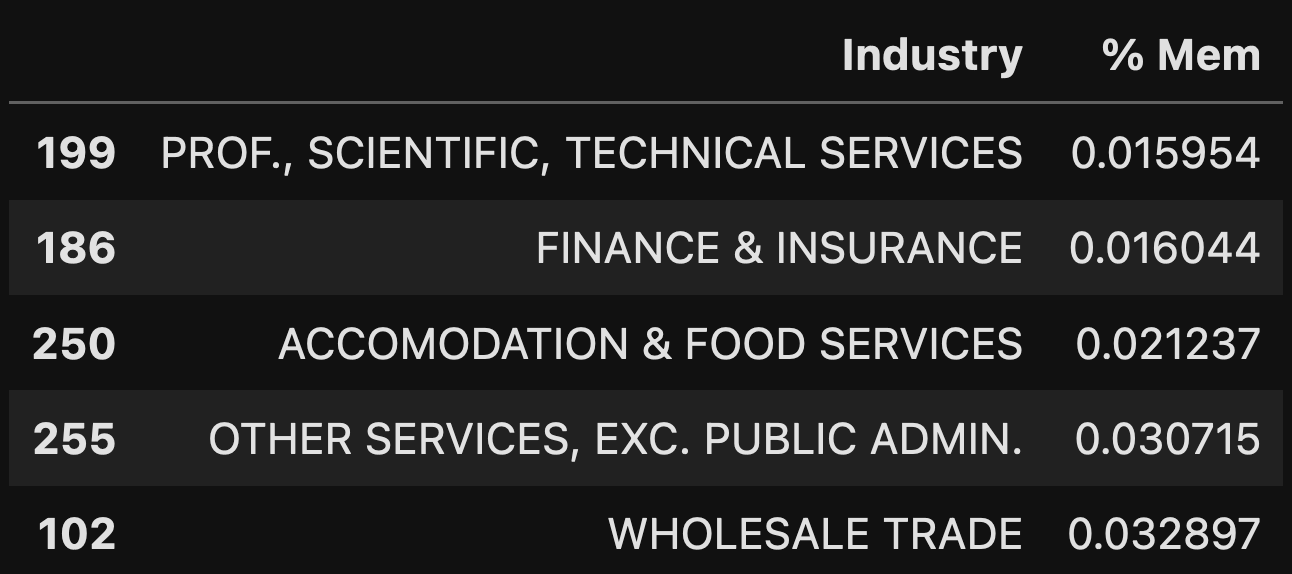
The least likely industry to be unionized? People in scientific and technical fields, which makes a lot of sense given the very small number of unionized workers in tech companies.