


[Hey — Are you at the Euro Python conference in Prague? Find me and say “hi”! I’m around through Friday afternoon.]
This week, we’re looking at a recent report from the GEM, the Global Entrepreneurship Monitor (https://gemconsortium.org). In particular, we’re looking at their APS (adult population study), which asks adults from around the world what they think about creating a business.
The latest GEM report came out earlier this year; you can download it from /content/files/file/open.pdf . We’ll use the latest APS data to understand the state of entrepreneurship in various countries, and where there is more (and less) perceived opportunity.
Data and questions
The APS data can be downloaded in CSV format:
- Go to https://www.gemconsortium.org/data/key-nes
- Click on all three of the "all" boxes (for choosing an economy, an indicator, and a year)
- Click on "export" to get the CSV file downloaded to your computer.
Yesterday, I gave you 8 questions and tasks:
Import the APS data into a data frame. Use the short name of each column as the column name.
As usual, I started my solution by importing the Pandas library with the conventional alias:
import pandas as pdWith that in place, I needed to create a data frame from the CSV file. But what did I mean by “use the short name of each column”?
It turns out that the CSV file has two header lines — one with a long description on the first line of the file, and one with a short one on the second line. If you read the CSV file using read_csv and all of its default arguments, you’ll not only get the long descriptions as the column names, but the short descriptions will be seen as the first line of data. Which will mess up the dtypes for all of the numeric columns, because they’ll have a mix of text (the short names) and numbers.
The solution is to ignore the long names completely, and only use the short names, by telling read_csv that the headers are on line 1, rather than the (default) line 0:
df = pd.read_csv(filename, header=1)The resulting data contains 1083 rows and 18 columns. Each row represents the results of APS for one year in one country. That’s a natural way for the file to be created, but it’ll give us some trouble when we try to analyze it. But that’s OK; we have some ways to rejigger it into a more useful format.
In 2022, which 10 countries had the highest "Perceived Opportunities" scores?
The “year” column in our data frame indicates the year in which a survey was done. In order to answer this question, we’ll need to grab only those rows with a year of 2022. That’s most easily done by using the “==” operator on the column, giving us a boolean series back:
df['year'] == 2022We can then use “.loc” with that boolean series to retrieve those rows from “df” from 2022:
df.loc[df['year'] == 2022]Applying a boolean series to .loc is one of the most common actions we do in Pandas; it keeps the rows with a value of True, and drops those with a value of False. By constructing the boolean series based on our comparison, we effectively keep only those rows from 2022.
But that’s just the start: We want to find the countries with the highest score for perceived opportunities. I’m going to use the two-argument version of “.loc”, then. The first argument remains a row selector, indicating which rows we want from df. The second argument is a column selector, indicating which columns we want. As with the row selector, we can indicate our selection in a number of ways, including a list of strings:
df.loc[
    df['year'] == 2022,                     # row selector
    ['economy', 'Perceived opportunities']  # column selector
]
This query returns a data frame based on df with only the rows from 2022, and only the columns “economy” and “Perceived opportunities.”
Note that some people really like to specify columns in Pandas using dot notation, (e.g., df.x) rather than square-bracket-string notation (e.g., df[‘x’]). I avoid the former, even if it’s a bit shorter to write, because it cannot handle column names with spaces and special characters — precisely what we have here.
How can we find the countries with the greatest perceived opportunities? We sort our data frame using the sort_values method. Here, I’ll use method chaining to achieve this:
(
    df.loc[df['year'] == 2022,
           ['economy', 'Perceived opportunities']]
    .sort_values('Perceived opportunities',
                 ascending=False)
)
In order to use method chaining across lines, I use the trick of opening parentheses, which tricks Python into thinking that I really have one line, even though I have many. I take the data frame returned by our call to “loc” and immediately apply sort_values to it. I ask for the the rows of our two-column result to be sorted in descending order. That allows me to then grab the 10 top lines with head:
(
    df.loc[df['year'] == 2022,
           ['economy', 'Perceived opportunities']]
    .sort_values('Perceived opportunities',
                 ascending=False)
    .head(10)
)
Finally, just to make it a bit easier to read, I decided to make the “economy” column into the index:
(
    df.loc[df['year'] == 2022,
           ['economy', 'Perceived opportunities']]
    .sort_values('Perceived opportunities',
                 ascending=False)
    .head(10)
    .set_index('economy')
)
The result? A mix of countries that I hadn’t expected:
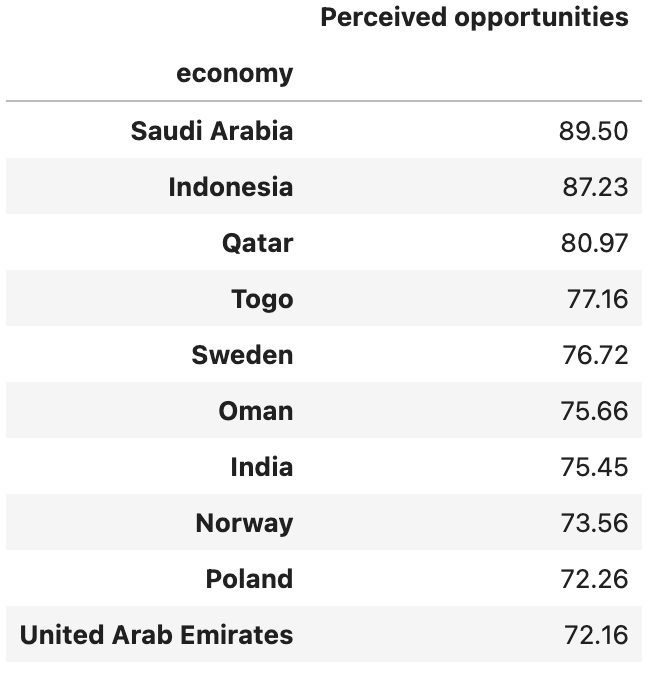
People see lots of opportunities in Saudi Arabia? I had heard that the government there was really trying to promote a diversification of their economy away from petroleum, and perhaps this reflects that. The fact that we see Qatar, Oman, and the UAE here might be for similar reasons. I expected to see India and Indonesia, but didn’t think that Sweden, Norway, and Poland were all that entrepreneurial.
And hey, what about Israel, where I live, where everybody seems to talk about starting a company, and where people talk about us being the start-up nation? I was surprised to see us nowhere here.
It would seem that my preconceptions were rather off! Good thing that someone does actual surveys, collecting actual data.