


I'm repeating the two announcements from yesterday, in case you missed them:
- Pandas 3 will be coming out soon, and as we saw last week, it includes a number of changes. I'm recording videos about the Pandas 3 upgrade on YouTube; you can see them on my Pandas 3 playlist, here: https://www.youtube.com/watch?v=TCSjgvtO714&list=PLbFHh-ZjYFwFWHVT0qeg9Jz1TBD0TlJJT
- Like many other online creators and instructors, I've written an end-of-year summary of what I did this year, and what plans I have for 2026. You can read it at: https://lerner.co.il/2025/12/23/reuvens-2025-in-review/
Meanwhile, back to this week's topic, Kalshi, a "prediction market," meaning an online platform that allows you to make predictions about the future. You can predict who will win an election, or on the value of a particular currency (or cryptocurrency) at a particular time, on whether Netflix will successfully buy Warner-Discovery, or on any number of other events in our world.
In practice, numerous commentators say that prediction markets are quickly becoming platforms for sports gambling. Such gambling, as we saw in BW 100, back in January of this year, is extremely popular, especially among young people.
Kalshi isn't officially a gambling platform, but the state of Nevada has sued to stop Kalshi from allowing its residents from entering into sports markets (https://finance.yahoo.com/news/kalshi-risk-nevada-enforcement-court-173246378.html).
Kyla Scanlon argues that the spread of gambling reflects other issues in modern society, and specifically mentions Kalshi in one of her latest essays, at https://kyla.substack.com/p/everyone-is-gambling-and-no-one-is .
For all of these reasons, I thought it would be interesting to look at Kalshi: What sorts of questions are people trying to ask? Is it really being used for sports betting? And do we see the number of predictions on Kalshi growing over time?
Data and five questions
Kalshi offers an API to retrieve information about just about any part of the system. If you're looking to get information about public events and markets, rather than your own personal predictions or portfolio, then the API is totally open and free to use. However, the official Kalshi API package on PyPI (https://pypi.org/project/kalshi-python/) crashed on me pretty consistently.
Using the Kalshi API documentation (https://docs.kalshi.com/welcome), Claude, and some patience, I was able to write code that uses requests to retrieve all of the events in Kalshi — and then each of the markets for that event. Here's the code, which took about 15 minutes to run and download all of the events and markets:
In case you aren't a Kalshi guru, here are a few basics:
- Kalshi has defined a number of events. An event can be an election, a sports game, or a financial market.
- Within each event, Kalshi has defined a number of markets. Each market is a particular prediction with a yes/no outcome. For example:
- For the 2024 election event, a market would be that Trump will beat Biden.
- For the 2024 election event, a market would be that Trump will beat Biden by 10 percentage points nationally.
- For the 2024 election event, a market would be that Trump will beat Biden in at least three swing states.
- For the 2025 baseball World Series event, a market could be that the LA Dodgers will get in.
- For the 2025 baseball World Series event, a market could be that the LA Dodgers will play the Toronto Blue Jays.
- For the 2025 baseball World Series event, a market could be that the LA Dodgers will beat the Toronto Blue Jays.
- For the 2025 baseball World Series event, a market could be that the LA Dodgers will beat the Toronto Blue Jays by 3 runs.
- You can buy a contract for a particular market. That indicates you think that the answer will be "yes" to the market's question. The contract's price is between 1 cent and 99 cents. If you want to BUY, you pay the
yes_askprice (what sellers are asking). If you want to SELL, you receive theyes_bidprice (what buyers are offering). - If lots of people want a particular contract, then the price will go up, to a maximum of 99 cents. If very few people want a contract, then the price will go down, to a minimum of 1 cent.
- If you buy a contract for 48 cents and you're right, you get $1 back (profit: 52 cents).
- If you buy a contract for 48 cents and you're wrong, you get $0 (loss: 48 cents).
- If you own a contract and want to sell it before the event resolves, you sell at the
yes_bidprice (what buyers are offering).
Learning goals for this week include: Working with APIs, dates and times, grouping, and plotting.
Paid subscribers, including members of my LernerPython.com membership program, get the data files provided to them, as well as all of the questions and answers each week, downloadable notebooks, and participation in monthly office hours.
Here are my solutions and explanations for this week's five tasks and questions:
The program that I've provided asks Kalshi for all of the events in its database, and all of the markets associated with each event. Convert the open_time and close_time columns in that data frame to datetime values with a UTC time zone and 1-second granularity.
Let's start by looking at the program I used to download the information from Kalshi's API. I started by loading the modules I would need:
import marimo as mo
import pandas as pd
from plotly import express as px
import requests
I imported not only marimo (because I'm using a Marimo notebook) and Pandas (to use Pandas), but also plotly.express to create plots and requests to retrieve from Kalshi's API. As I wrote above, I was really hoping to use the PyPI package as a Kalshi client, but that wasn't possible.
Since I was interested in getting every event, and then every market in every event, I decided to use the /events API endpoint in the Kalshi API. I passed this URL to request.get, adding three parameters:
limitof 200, to indicate that I want the maximum number of results with each request,with_nested_marketsofTrue, to get all of the markets associated with each eventcursor, which indicates the page from which I want to start reading. By settingcursortoNonein the first iteration, and then grabbing the returnedcursorvalue from each set of results, Python can get a new page of results with each request to Kalshi.
The response object from Kalshi contains metadata about the response (e.g., response headers) as well as the JSON-encoded response from the server. By invoking json() on the response object, we get the contents, a Python list of dictionaries. I invoked all_events.extend to add these events to the list into which we're accumulating them, get the cursor for the next round, and then go back for more.
Notice that the loop ends if cursor, which normally indicates with which page to start the list of results, gets a None value back in the response. In other words: After we get a response object with a bunch of legal values, if cursor tells us that there are no more to be gotten, we can stop.
Notice the use of dict.get here, which retrieves a value from a dictionary using a key — but if the key doesn't exist, then we get None, rather than a KeyError exception:
    BASE_URL = "https://api.elections.kalshi.com/trade-api/v2"

    all_events = []
    cursor = None
    round = 0

    while True:
        params = {
            'limit': 200,
            'with_nested_markets': 'true'
        }
        if cursor:
            params['cursor'] = cursor

        response = requests.get(f"{BASE_URL}/events", params=params)
        data = response.json()

        events = data.get('events', [])
        all_events.extend(events)

        cursor = data.get('cursor')
        if not cursor:
            break

        round += 1
        print(f'Downloading round {round}')

    print(f"Events fetched: {len(all_events)}")
In long-running programs, I always like to have a running printout or counter, just to know where things are. Thanks to this printout, I found that there were 509 pages of events, with a total number of 181,881 individual events.
That would have been enough for a data frame of events. But I actually wanted each of the markets. So I created an empty list (all_markets), and then iterated over each market in each event. For each market, I added an element to all_markets, adding the event title and category to that market. I then created a data frame from all_markets:
    all_markets = []
    for event in all_events:
        category = event.get('category')
        event_title = event.get('title')

        for market in event.get('markets', []):
            market['category'] = category
            market['event_title'] = event_title
            all_markets.append(market)

    df_ = pd.DataFrame(all_markets)
    print(f"Total markets: {len(df_)}")
My intention was to have you figure out how to turn the open_time and close_time columns into datetime dtypes, but I forgot to exclude it from the code I provided to you. Let's review what I did, since there are some non-obvious parts to this code:
    for one_column in ['open_time', 'close_time']:
        print(f'Processing datetime for {one_column}...', end='')
        df_[one_column] = pd.to_datetime(df_[one_column], format='ISO8601', utc=True).dt.as_unit('s')
        print('Done.')
In theory, I wanted to just run pd.to_datetime on each of the columns. But that turned out to be a problem, because some of these markets have start times very far back in the past, or very far in the future – too far for us both to have nanosecond time units and a 64-bit datetime value. The solution is to use a different unit, such as seconds – but to do that, we need to be a bit sneaky. I first told it to use ISO8601 format in pd.to_datetime. I then used .dt.as_unit('s') to get the value back with seconds as units. And... it worked! I did this for both open_time and close_time.
And with that, we were done – and now have a data frame with 4,338,169 rows and 58 columns. I should add that on my computer running Pandas 2, this consumed 11.2 GB of memory! I decided to reduce that memory by turning all of the string ('object', in Pandas 2) columns into categories:
for one_column in df.select_dtypes('object').columns:
    print(f'Processing {one_column}...', end='')
    try:
        df[one_column] = df[one_column].astype('category')
        print('Done.')
    except TypeError as e:
        print(f'Cannot process {one_column}; continuing')
Notice that I trap for TypeError exceptions when doing this. That's to avoid problems with at least one column, which contained Python lists. This is yet more proof of why it's a great thing Pandas 3 will have a real built-in str type, rather than rely on object, which can be confused with other types!
After categorizing the strings, I reran df.info(memory_usage='deep'), and got a size of 3.3 GB. That's right – but running the above for loop, which took 20 seconds, I chopped off about 75% of the memory usage of my data frame. Not bad at all. The reduced memory usage will almost certainly speed up my queries. And even if that's not the case, I'll be able to fit more data into a single data frame.
Which 10 events had the greatest number of markets? Which 10 events had the greatest number of contracts bought and sold (the volume column)? Why would you see a difference between the result of this query and the previous one? Create a bar plot showing the volume of contracts, per month. Do we see any growth in Kalshi since it launched? Does the fact that Kalshi won court cases in September and October of 2024 seem to have had an effect?
Now that we have the data frame in place, we can start to ask questions about it.
First, I was curious to know which 10 events had the greatest number of markets. I should note that Kalshi defines both the events and the markets; you cannot decide to create an event, "Ice cream party," and then a market for, "Reuven eats both chocolate and vanilla." (Which are far too boring for me to choose as flavors, but I digress.) I was thus curious to know, given the events defined by Kalshi, which had the greatest number of markets associated with them?
I used groupby on two columns, event_ticker and event_title, since the first is unique and the second is actually useful for humans. I then invoked sort_values to get the results in order from highest to lowest. Finally, I used head, to ensure we only see the top 10 values.
Finally, I invoked reset_index to drop the outer (event_ticker) column. I said drop=True to get rid of it, rather than turn it into a column in the data frame.
Notice that I used the size method, which returns the number of rows – rather than count, which returns the number of non-NaN values. There shouldn't be any NaN values here anyway, so I could have used either. In any event, here's the query:
(
    df
    .groupby(['event_ticker', 'event_title'], observed=True).size()
    .sort_values(ascending=False)
    .head(10)
    .reset_index(level='event_ticker', drop=True)
)
Notice that I made sure to say observed=True. This tells Pandas that when we're grouping on a categorical column, it only has to take into account those categories that actually exist in the column. In our case, where we created the categories based on the actual values in the column, that's not an issue — but if you create a category before the column, then it can be one. Pandas 3 will change the behavior for grouping on categories, such that the default will be observed=True. For now, it's a good idea to make it explicit.
The results:
event_title	value
2025 Grammys for Album of the Year, Best New Artist, Record of the Year and Song of the Year?	797
All Oscar nominations for Best Picture?	542
2025 Oscars for Best Picture, Best Actor, Best Actress, Best Supporting Actor, Best Supporting Actress, Best Director, Best Animated Feature, Best International Feature Film, Best Original Screenplay and Best Adapted Screenplay?	431
Nasdaq price on Apr 7, 2025 at 10am EDT?	401
Nasdaq price on Apr 7, 2025 at 11am EDT?	401
Nasdaq price on Apr 7, 2025 at 12pm EDT?	401
Nasdaq price on Apr 7, 2025 at 1pm EDT?	401
Nasdaq price on Apr 7, 2025 at 2pm EDT?	401
Nasdaq price on Apr 7, 2025 at 3pm EDT?	401
S&P price on Nov 21, 2025 at 12pm EST?	400
In other words, the greatest number of markets was for the 2025 Grammy awards – but just for a handful of awards, not all of them. Next came Oscar nominations for best picture, followed by 2025 Oscars for specific categories.
From what we can see here, it looks like entertainment and finance are the most common markets on Kalshi. And that's true, in a technical sense.
But having lots of markets for an event doesn't necessarily mean that lots of people were really buying into those markets. To check the actual popularity among Kalshi users, we counted the number of contracts.
To do that, I again used groupby on event_ticker and event_title. But I calculated only on the volume column, and used sum as the aggregation method. The rest was actually the same as before:
(
    df
    .groupby(['event_ticker', 'event_title'], observed=True)['volume'].sum()
    .sort_values(ascending=False)
    .head(10)
    .reset_index(level='event_ticker', drop=True)
)
The results were rather different:
event_title	volume
Who will win the Presidential Election?	535948943
Popular vote margin of victory?	134863999
Pro Men's Basketball: Champion?	130267765
New York City Mayor Election	121642553
Fed decision in Sep 2025?	91819656
Pro Baseball Champion?	87832894
Masters Tournament Winner?	86824128
Electoral College margin of victory?	86308117
Popular vote margin of victory (0.25% ranges)?	84757997
How long will the government shutdown last?	82576537
The events with the greatest number of contracts were in politics – which makes sense, given how much we read about Kalshi being used instead of polling to predict the election. (Of course, there are some problems with that methodology, including the fact that a wealthy person could buy a huge number of contracts, and/or that people buying on Kalshi aren't just citizens of a particular country.)
Next, I was curious to know if the number of contracts had changed in any dramatic way over the last few years, with a bar chart showing monthly total contracts. To do that, I first used set_index to make open_time the index. That allowed me to run resample, a form of groupby that works on chunks of time, and which only works when you have a datetime index.
I thus asked to see the sum of volume for each one-month period in our data set. Then I used pipe to invoked px.bar, giving me a bar plot:
(
    df
    .set_index('open_time')
    .resample('1ME')['volume'].sum()
    .pipe(px.bar)
)
Here's the plot that I got:
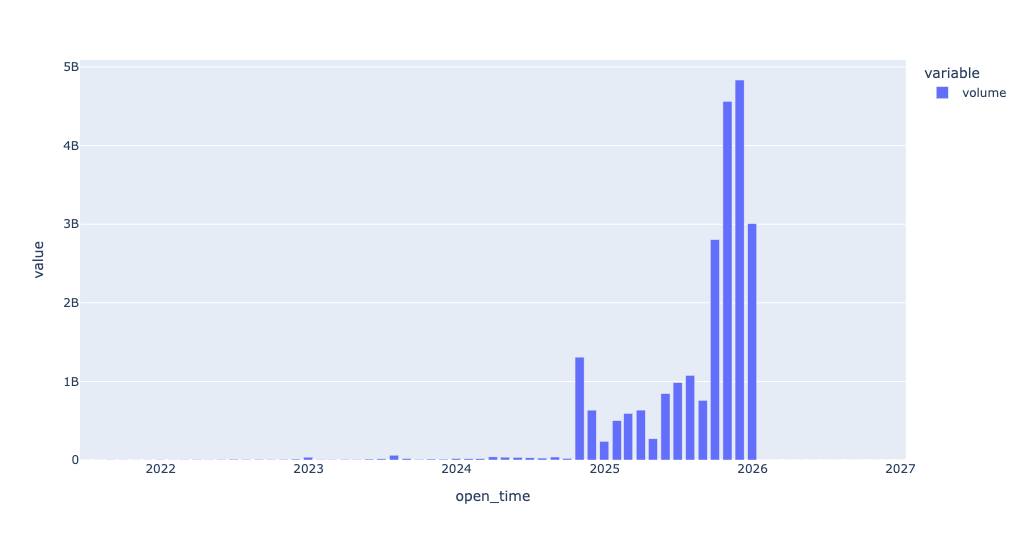
Looking at these numbers, we see a huge burst in the number of contracts in the autumn of 2024. Now, you could argue that this was because there was a US presidential election happening, and that's probably true. But there were also two court cases, in September and October 2024, that allowed Kalshi to open a variety of markets. And... it would sure seem that they did! It's amazing to me that we can see, so clearly and obviously, the results of a court decision.