


I've been sick with something (probably the flu) for a week or two, and while I'm feeling better each day, the infections keep coming and spreading. Just a few days ago, New York's acting health commissioner said that flu cases are "skyrocketing" in the city (https://www.nytimes.com/2025/12/16/nyregion/flu-cases-nyc.html?unlocked_article_code=1.9U8.C9hd.BYSZ35XQZRqc&smid=url-share).
This week, we looked at the spread of the flu (aka influenza) in the United States, using data from the Centers for Disease Control and Prevention (CDC).
The CDC measures the flu (a) from clinics that report how many patients come in with flu-like symptoms, (b) from actual tests performed, which report the number of positive flu cases from those who feel sick, and (c) from public-health laboratories, which check which specific strain of flu someone has.
Combining these three sources of data makes it possible to understand this year's flu, compare it with previous years' flu seasons, and prepare for future season.
In separate news, the Pandas core team announced that a release candidate for Pandas 3.0.0 is now available (https://pandas.pydata.org//community/blog/pandas-3.0-release-candidate.html). This means that Pandas 3.0 is close to release, and with it, we'll see a number of big changes. This week's questions will thus ask you not only to solve problems with the CDC's data, but also to compare Pandas 2 with Pandas 3, comparing speed, memory, and syntax.
To get a Pandas 3 environment going, I suggest using uv. (Unsure how to use uv? Check out my free, 15-part "uv Crash Course" at https://uvCrashCourse.com .) On my Mac, in the terminal, I typed:
$ cd ~/Desktop
$ uv init bwpd3
$ cd bwpd3
$ uv add 'pandas==3.0.0rc0' marimo[recommended] pyarrow plotly
Data and five questions
This week's data comes from the CDC's FluView portal. The data comes from their main dashboard at https://gis.cdc.gov/grasp/fluview/fluportaldashboard.html . . To get the data, I clicked on the green "download data" button at the top right of the page. I asked for both data sources (ILINet and NREVSS) and all HHS (Health and Human Services) regions. This resulting zipfile opens up to contain four CSV files, two of which we will use in our analysis.
Learning goals for this week include: Working with CSV files, Pandas 3, joins, pivot tables, memory optimization, speed optimization, window functions, and plotting.
Paid subscribers, including members of my LernerPython.com membership program, get the data files provided to them, as well as all of the questions and answers each week, downloadable notebooks, and participation in monthly office hours.
Here are my solutions and explanations:
Load the ILINet CSV data into a data frame in both Pandas 2 and Pandas 3. Is there a difference in loading time? Is there a difference in the amount of memory each uses? What differences do you see in dtypes that might account for this? Does using the PyArrow CSV-loading engine change things?
I started by loading both Pandas and Plotly:
import pandas as pd
from plotly import express as px
Next, I loaded the file into a data frame using read_csv:
filename = 'data/bw-149-FluViewPhase2Data/ILINet.csv'

df = pd.read_csv(filename, engine='pyarrow', header=1)
Notice that I used the PyArrow engine to load the CSV file, which is significantly faster than using the Python-based CSV-loading engine. I also passed header=1, which tells read_csv that it should skip the first line (i.e., line 0) in the CSV file, and take the number and names of the columns from the second one (i.e., line 1).
This created a data frame with 14,710 rows and 15 columns. In Pandas 2.3.3 (the latest version), this took 10 ms to execute.
The same code worked in Pandas 3.0.0rc0, and gave the same data frame. However, it took slightly longer, 12 ms.
The differences between Pandas versions was more obvious when we looked at the dtypes. In Pandas 2, I ran df.info() and got the following:
<class 'pandas.core.frame.DataFrame'>
RangeIndex: 14710 entries, 0 to 14709
Data columns (total 15 columns):
 #   Column             Non-Null Count  Dtype
---  ------             --------------  -----
 0   REGION TYPE        14710 non-null  object
 1   REGION             14710 non-null  object
 2   YEAR               14710 non-null  int64
 3   WEEK               14710 non-null  int64
 4   % WEIGHTED ILI     14710 non-null  float64
 5   %UNWEIGHTED ILI    14710 non-null  float64
 6   AGE 0-4            14710 non-null  int64
 7   AGE 25-49          9390 non-null   float64
 8   AGE 25-64          6270 non-null   float64
 9   AGE 5-24           14710 non-null  int64
 10  AGE 50-64          9390 non-null   float64
 11  AGE 65             14710 non-null  int64
 12  ILITOTAL           14710 non-null  int64
 13  NUM. OF PROVIDERS  14710 non-null  int64
 14  TOTAL PATIENTS     14710 non-null  int64
dtypes: float64(5), int64(8), object(2)
memory usage: 1.7+ MB
As the summary indicates, there are 5 float64 columns, 8 int64 columns, and – perhaps most importantly – 2 object columns. While Pandas uses NumPy for backend storage, NumPy's strings aren't very flexible. Which is why Pandas has traditionally used Python strings instead. The object dtype means that a reference to the Python string is stored in NumPy, rather than the string itself.
That's also why the memory is listed as "1.7+ MB," because Pandas is only calculating the amount of memory used by the NumPy storage, and not by the Python strings. The "+" means that the strings are almost certainly using more memory than that. We can get the full amount of memory by invoking df.info(memory_usage='deep'), and when we do, we get the following:
<class 'pandas.core.frame.DataFrame'>
RangeIndex: 14710 entries, 0 to 14709
Data columns (total 15 columns):
 #   Column             Non-Null Count  Dtype
---  ------             --------------  -----
 0   REGION TYPE        14710 non-null  object
 1   REGION             14710 non-null  object
 2   YEAR               14710 non-null  int64
 3   WEEK               14710 non-null  int64
 4   % WEIGHTED ILI     14710 non-null  float64
 5   %UNWEIGHTED ILI    14710 non-null  float64
 6   AGE 0-4            14710 non-null  int64
 7   AGE 25-49          9390 non-null   float64
 8   AGE 25-64          6270 non-null   float64
 9   AGE 5-24           14710 non-null  int64
 10  AGE 50-64          9390 non-null   float64
 11  AGE 65             14710 non-null  int64
 12  ILITOTAL           14710 non-null  int64
 13  NUM. OF PROVIDERS  14710 non-null  int64
 14  TOTAL PATIENTS     14710 non-null  int64
dtypes: float64(5), int64(8), object(2)
memory usage: 3.1 MB
The memory_usage='deep' option told df.info to calculate the actual storage used by the Python strings. This takes longer to execute, but is far more accurate – and shows that we're really using 3.1 MB, rather than 1.7 MB – nearly twice as much as was originally estimated! In data frames with even more string columns, or where the strings are long, the difference can be much larger.
How about in Pandas 3? What is going on there? I ran df.info() there, and got the following result:
<class 'pandas.DataFrame'>
RangeIndex: 14710 entries, 0 to 14709
Data columns (total 15 columns):
 #   Column             Non-Null Count  Dtype
---  ------             --------------  -----
 0   REGION TYPE        14710 non-null  str
 1   REGION             14710 non-null  str
 2   YEAR               14710 non-null  int64
 3   WEEK               14710 non-null  int64
 4   % WEIGHTED ILI     14710 non-null  float64
 5   %UNWEIGHTED ILI    14710 non-null  float64
 6   AGE 0-4            14710 non-null  int64
 7   AGE 25-49          9390 non-null   float64
 8   AGE 25-64          6270 non-null   float64
 9   AGE 5-24           14710 non-null  int64
 10  AGE 50-64          9390 non-null   float64
 11  AGE 65             14710 non-null  int64
 12  ILITOTAL           14710 non-null  int64
 13  NUM. OF PROVIDERS  14710 non-null  int64
 14  TOTAL PATIENTS     14710 non-null  int64
dtypes: float64(5), int64(8), str(2)
memory usage: 2.0 MB
We see three interesting things here:
- The string columns are marked as
str. This is something new in Pandas 3.0, in that it automatically uses PyArrow for storage of strings. No longer will strings be stored in Python's memory; they'll be kept along with the data frame, taking advantage of the Apache Arrow library's speed and compactness. - The memory usage isn't reported with a "+". Because the strings are all stored directly in the data frame, there is no need to estimate the size; Pandas has it available directly and immediately.
- PyArrow strings are smaller than Python strings by quite a bit, and thus reduce the size of our data frame significantly – in this case, by about one third. In larger data frames with more strings, I've seen far greater savings by using PyArrow.
Note that Pandas 3.0 only uses PyArrow for storage if it is installed. If it isn't, then it falls back to using the old Python strings. PyArrow was originally going to be required for Pandas 3.0, but that requirement has been removed by the core developers.
Note that the engine used for loading CSV files – the default Pandas engine, or the fancier and faster PyArrow engine – doesn't affect the way in which back-end storage is done. Indeed, you can say engine='pyarrow' even in Pandas 2, and things will typically load far faster.
How different is 2025's flu season in New York? Based on the ILINet data, create a data frame whose rows are the week numbers, whose columns are the years, and whose values consist of weighted percentage of patients reporting visits for flu-like infections in HHS region 2 (New York and New Jersey). Plot these numbers such that you can compare infection rates for the same week across years starting in 2020. Does this year's infection rate seem higher? If using Pandas 3, use the col syntax rather than lambda.
The ILInet data tracks people who complain of flu-like symptoms, even if they aren't sick with the flu. It tracks them by HHS region, by year, and by week number. I wanted to compare each week in the last five years to see if there were significantly more people feeling sick in 2025. Note that this doesn't mean they necessarily have the flu; the sampling and testing that FluView tracks can show what people are sick with.
To start, I used a combination of loc and lambda to keep only the rows from Region 2, and only rows in which YEAR was at least 2020:
(
    df
    .loc[lambda df_: df_['REGION'] == 'Region 2']
    .loc[lambda df_: df_['YEAR'] >= 2020]
)
I next created a pivot table in which the week numbers were the index (i.e., labeling the rows) and the years were labeling the columns. However, Marimo warned me that Pandas doesn't like to have integer names on columns. I thus used assign to turn YEAR into a string column by invoking astype(str) and then assigning that new series back to YEAR.
I then invoked pivot_table, indicating that WEEK should serve as the index, YEAR should serve as the columns, and that the values themselves should come from % WEIGHTED ILI:
(
    df
    .loc[lambda df_: df_['REGION'] == 'Region 2']
    .loc[lambda df_: df_['YEAR'] >= 2020]
    .assign(YEAR = lambda df_: df_['YEAR'].astype(str))
    .pivot_table(index='WEEK',
                columns='YEAR',
                values='% WEIGHTED ILI')
)
In case you're wondering what the weighting is for, it's to ensure that the numbers match up across regions and years, taking into account the number of patients reporting symptoms and also the number of providers measuring them. A region with 100 doctors can obviously see many fewer people than one with 100,000 doctors. Those example numbers are obviously exaggerated, but the CDC takes those differences into account, and ensures that we can compare regions and years against one another, even if the number of doctors changes from year to year.
Finally, I created a line plot from this data. I like to use Plotly, but as regular readers know, that makes it harder to incorporate method chaining. The solution is to use the pipe method, which effectively allows us to turn any function into a method. Here, pipe receives the data frame from pivot_table, and passes it to px.line as an argument:
(
    df
    .loc[lambda df_: df_['REGION'] == 'Region 2']
    .loc[lambda df_: df_['YEAR'] >= 2020]
    .assign(YEAR = lambda df_: df_['YEAR'].astype(str))
    .pivot_table(index='WEEK',
                columns='YEAR',
                values='% WEIGHTED ILI')
    .pipe(px.line)
)
Here is the resulting plot:
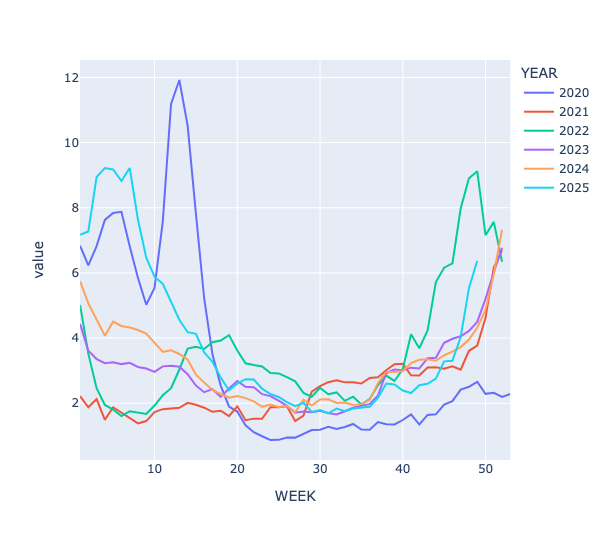
The data for 2025 is in light blue, and you can see that while the number of cases isn't yet as high as in previous years, the line is shooting up, and will likely match or surpass previous years' rates within one or two weeks.
What about in Pandas 3?
We could use the same syntax as Pandas 2. But Pandas 3 introduces a new syntax, pd.col, which dramatically simplifies the syntax of our chained loc expressions. Simply put, pd.col is a function that takes the name of a function (i.e., a string). It returns a "deferred object" that can then be used similarly to the data frame inside of our lambda expressions, but without the overhead.
To check if YEAR is >= 2020, we don't have to create an entire anonymous function with lambda, give it a parameter df_, and then compare df_['YEAR'] >= 2020, We can instead just say pd.col('YEAR') >= 2020, and both Pandas and loc know what to do.
Note that pd.col is a function, which means that the column name goes in round parentheses, (), rather than square brackets, []. pd.col can be used in assign values, as well, as you can see in this expression.
Here's the query, rewritten to use the new syntax:
(
    df
    .loc[pd.col('REGION') == 'Region 2']
    .loc[pd.col('YEAR') >= 2020]
    .assign(YEAR = pd.col('YEAR').astype(str))
    .pivot_table(index='WEEK',
                columns='YEAR',
                values='% WEIGHTED ILI')
    .pipe(px.line)
)
Somewhat to my surprise, I found that the pd.col syntax was slightly slower than lambda by about 10-15 percent.