


I'm writing from Taiwan, where I'll be participating in PyCon Taiwan this coming weekend, including giving two talks. (If you're going to be there, please come and say "hi" to me in person!) I've been having a great deal of fun, hiking around some of Taiwan's natural beauty in between teaching courses and preparing conference talks.
Don't get me wrong; I've been having a spectacular time hiking around, and even managed to see some monkeys and a pheasant mid-day on Thursday. But there's no doubt that the weather is generally hot and humid. I've managed to avoid being rained on for three days in a row, which demonstrates more luck than skill, but it's clear that rain happens pretty often.
This led me to wonder: How hot does it get? How much does it rain? And is it always this humid?
This week, we'll thus look through a data set from the Taiwanese government, looking at the climate of Taipei, which is where PyCon Taiwan will be held. It'll not only give you a chance to understand something about Taipei's weather, but also how to wrestle data into submission when it comes formatted in ways you didn't expect.
Data and five questions
This week's data set is a CSV file provided by the government of Taipei City. The page from which you can download the data is at https://data.gov.tw/en/datasets/145785, and the CSV file itself can be downloaded from https://tsis.dbas.gov.taipei/statis/webMain.aspx?sys=220&ymf=8701&kind=21&type=0&funid=a04000101&cycle=1&outmode=12&compmode=00&outkind=1&deflst=2&nzo=1 .
Learning goals for this week include: Working with non-Latin characters, renaming columns, handling date-time information, pivot tables, styling, and plotting.
Paid subscribers, including members of my LernerPython+data membership program at https://LernerPython.com, can download a copy of the data from a link at the bottom of this message. Paid subscribers can also download my Jupyter/Marimo notebooks and participate in monthly office hours.
Here are my solutions and explanations for the five questions I posed yesterday:
Load the CSV file into a data frame. Convert the column names (which are originally in Chinese) into English, using the "data fields" list on the data page. Also convert the "statistical period" column into datetime values, keeping in mind that the dates in the original data are written as 87年 1月, where the first number is the Republic of China year (i.e., where year 1 is 1912) and the second number is the month, so "1月" means January and "1月" means February.
Before dealing with anything else, I loaded up Pandas:
import pandas as pdLoading the data frame wasn't that hard, using the read_csv method:
filename = 'data/bw-134-tw-weather.csv'

df = (
      pd
      .read_csv(filename)
      )

df
This did load the file successfully. But I asked you to go beyond that, changing the column names from Chinese into English, and also turning the stat_period column into a Pandas datetime dtype.
Renaming the columns isn't that hard, especially if we know what they should be called and their order. There wasn't a data dictionary for this data set per se, but there was an English-language list of translations for the columns at https://data.gov.tw/en/datasets/145785 . We can create a list of strings from that Web page, and pass the list to the names keyword argument we pass to read_csv:
df = (
      pd
      .read_csv(filename,
                names=['stat_period',
                       'mean_temp',
                       'mean_humidity',
                       'hours_sunshine',
                       'mm_precipitation',
                       'number_of_rainy_days']
      )
)
However, this doesn't quite do the job: Passing the names keyword argument implies that there aren't any headers, which means that the Chinese names for the columns are treated as the first row of data. In order to convince Pandas to ignore that first row, rather than include it, we need to pass the header keyword argument, indicating that the headers are in row 0. The combination of header=0 and names effectively replaces the names with what we want:
df = (
      pd
      .read_csv(filename,
                names=['stat_period',
                       'mean_temp',
                       'mean_humidity',
                       'hours_sunshine',
                       'mm_precipitation',
                       'number_of_rainy_days'],
                header=0)
      )
)
This worked just great. But how can we turn the stat_period column into a datetime column? The values look like 87年 1月, which indicates (a) the Republic of China year, used to keep track of years in Taiwan beginning in 1912, and (b) the month of the year.
At first, I thought that I might want to use the Chinese characters in a regular expression to grab the year and the month, and then wrestle them into a datetime value. But then I realized that the Chinese characters are irrelevant; if I could get rid of them, then I would have strings in the from of YEAR MONTH, which would be closer. Granted, the YEAR value in the string would be the unique-to-Taiwan ROC year, but it would still be closer.
I decided to use multiple keyword arguments to assign, the Pandas method that lets us create a new column. One of the nice things about assign is that it works in order, meaning that later keyword arguments can use earlier ones.
- I first created a
year_and_monthcolumn, using alambdaexpression on thestat_periodcolumn along with a regular expression. I told the regex, passed tostr.replace, to remove anything other than digits (\d) and the space character using a character class ([%\d ]) with the empty string. This left me with a year-month pair in each string, separated by a space. I then invokedstr.spliton the resulting string, giving me a list of two strings in each row. - Next, I created a new
yearcolumn by grabbing the 0-index value fromyear_and_monthusingstr.get. It might seem weird to invoke a string method on a list, but it works! After getting the years, I then turned them into integers usingastype, adding 1911 to the number, and then turning it back into a string. - Next, I created a new
monthcolumn by grabbing the 1-index value fromyear_and_monthusingstr.getagain. - I then (finally!) assigned to
state_period, replacing the original column, by invokingpd.to_datetimeon a combination of ouryearandmonthcolumns, followed by'0-1'for the first day of each month:
df = (
      pd
      .read_csv(filename,
                names=['stat_period',
                       'mean_temp',
                       'mean_humidity',
                       'hours_sunshine',
                       'mm_precipitation',
                       'number_of_rainy_days'],
                header=0)

          .assign(year_and_month = lambda df_: df_['stat_period'].str.replace(r'[^\d ]', '', regex=True).str.split(),
            year = lambda df_: (df_['year_and_month'].str.get(0).astype(int) + 1911).astype(str),
            month = lambda df_: df_['year_and_month'].str.get(1),
            stat_period = lambda df_: pd.to_datetime(df_['year'] + '-' + df_['month'] + '-01'))
)
Finally, I invoked df.drop to remove the new columns that I had just made:
df = (
      pd
      .read_csv(filename,
                names=['stat_period',
                       'mean_temp',
                       'mean_humidity',
                       'hours_sunshine',
                       'mm_precipitation',
                       'number_of_rainy_days'],
                header=0)

          .assign(year_and_month = lambda df_: df_['stat_period'].str.replace(r'[^\d ]', '', regex=True).str.split(),
            year = lambda df_: (df_['year_and_month'].str.get(0).astype(int) + 1911).astype(str),
            month = lambda df_: df_['year_and_month'].str.get(1),
            stat_period = lambda df_: pd.to_datetime(df_['year'] + '-' + df_['month'] + '-01'))
    .drop(columns=['year', 'month', 'year_and_month'])
)
The result? A data frame with datetime values in a standard format, along with all of the columns relabeled in English. The data frame has a total of 331 rows and 7 columns.
Create a new data frame based on this one in which the years are the rows, the months are the columns, and the values are the total rainfall for that month. Style the data frame such that the heavier the rain, the darker the background color of the cell, limiting the floats to two digits after the decimal point. Which months (and years) stand out?
Whenever you want to take two categorical columns from an existing data frame, turning one into the columns and the other into the rows of a new data frame, you're likely looking at a pivot table. That's indeed what we have here:
- The rows are from
df['stat_period'].dt.year, grabbing theyearportion of the date via thedtaccessor, - The rows are from
df['stat_period'].dt.month_name(), grabbing the names of the months via the appropriate method on thedtaccessor, - The values themselves will be
mm_precipitation, and - We'll add up values, if they are any, from the same year and month into a single cell. (We shouldn't have any such duplicates, so it really shouldn't matter what
aggfuncvalue we pass.)
The query, using the pivot_table method:
(
    df
    .pivot_table(index=df['stat_period'].dt.year,
                 columns=df['stat_period'].dt.month_name(),
                 values='mm_precipitation',
                 aggfunc='sum')
)
However, if you do this, you'll find something curious has happened: By default, pivot_table, like all groupby operations, sorts the rows and columns. If the columns were the month numbers, then things would be fine. But I used month_name to get the month names, which sorted the columns... alphabetically, which is not the most useful way to sort the months of the year.
I thus passed sort=False, which turns that off, and keeps the columns (and rows) in their native order:
(
    df
    .pivot_table(index=df['stat_period'].dt.year,
                 columns=df['stat_period'].dt.month_name(),
                 values='mm_precipitation',
                 aggfunc='sum',
                sort=False)
)
I then asked you to style the data frame, using the style attribute that every data frame has. For starters, I invoked background_gradient, which puts a background color on every cell in the data frame, with lighter colors indicating lower values and darker colors indicating higher values.
Just as a method on a data frame returns a new data frame, a method on a style object returns a new style object. This means that we can continue to stack styling methods. I invoked format, which let me indicate floats should have a precision of 2 digits, and (while I'm at it) that we should put a comma before every group of three digits.
The resulting query looked like this:
(
    df
    .pivot_table(index=df['stat_period'].dt.year,
                 columns=df['stat_period'].dt.month_name(),
                 values='mm_precipitation',
                 aggfunc='sum',
                sort=False)
    .style.background_gradient()
    .format(precision=2, thousands=',')
)
Here's what it looked like on my system:
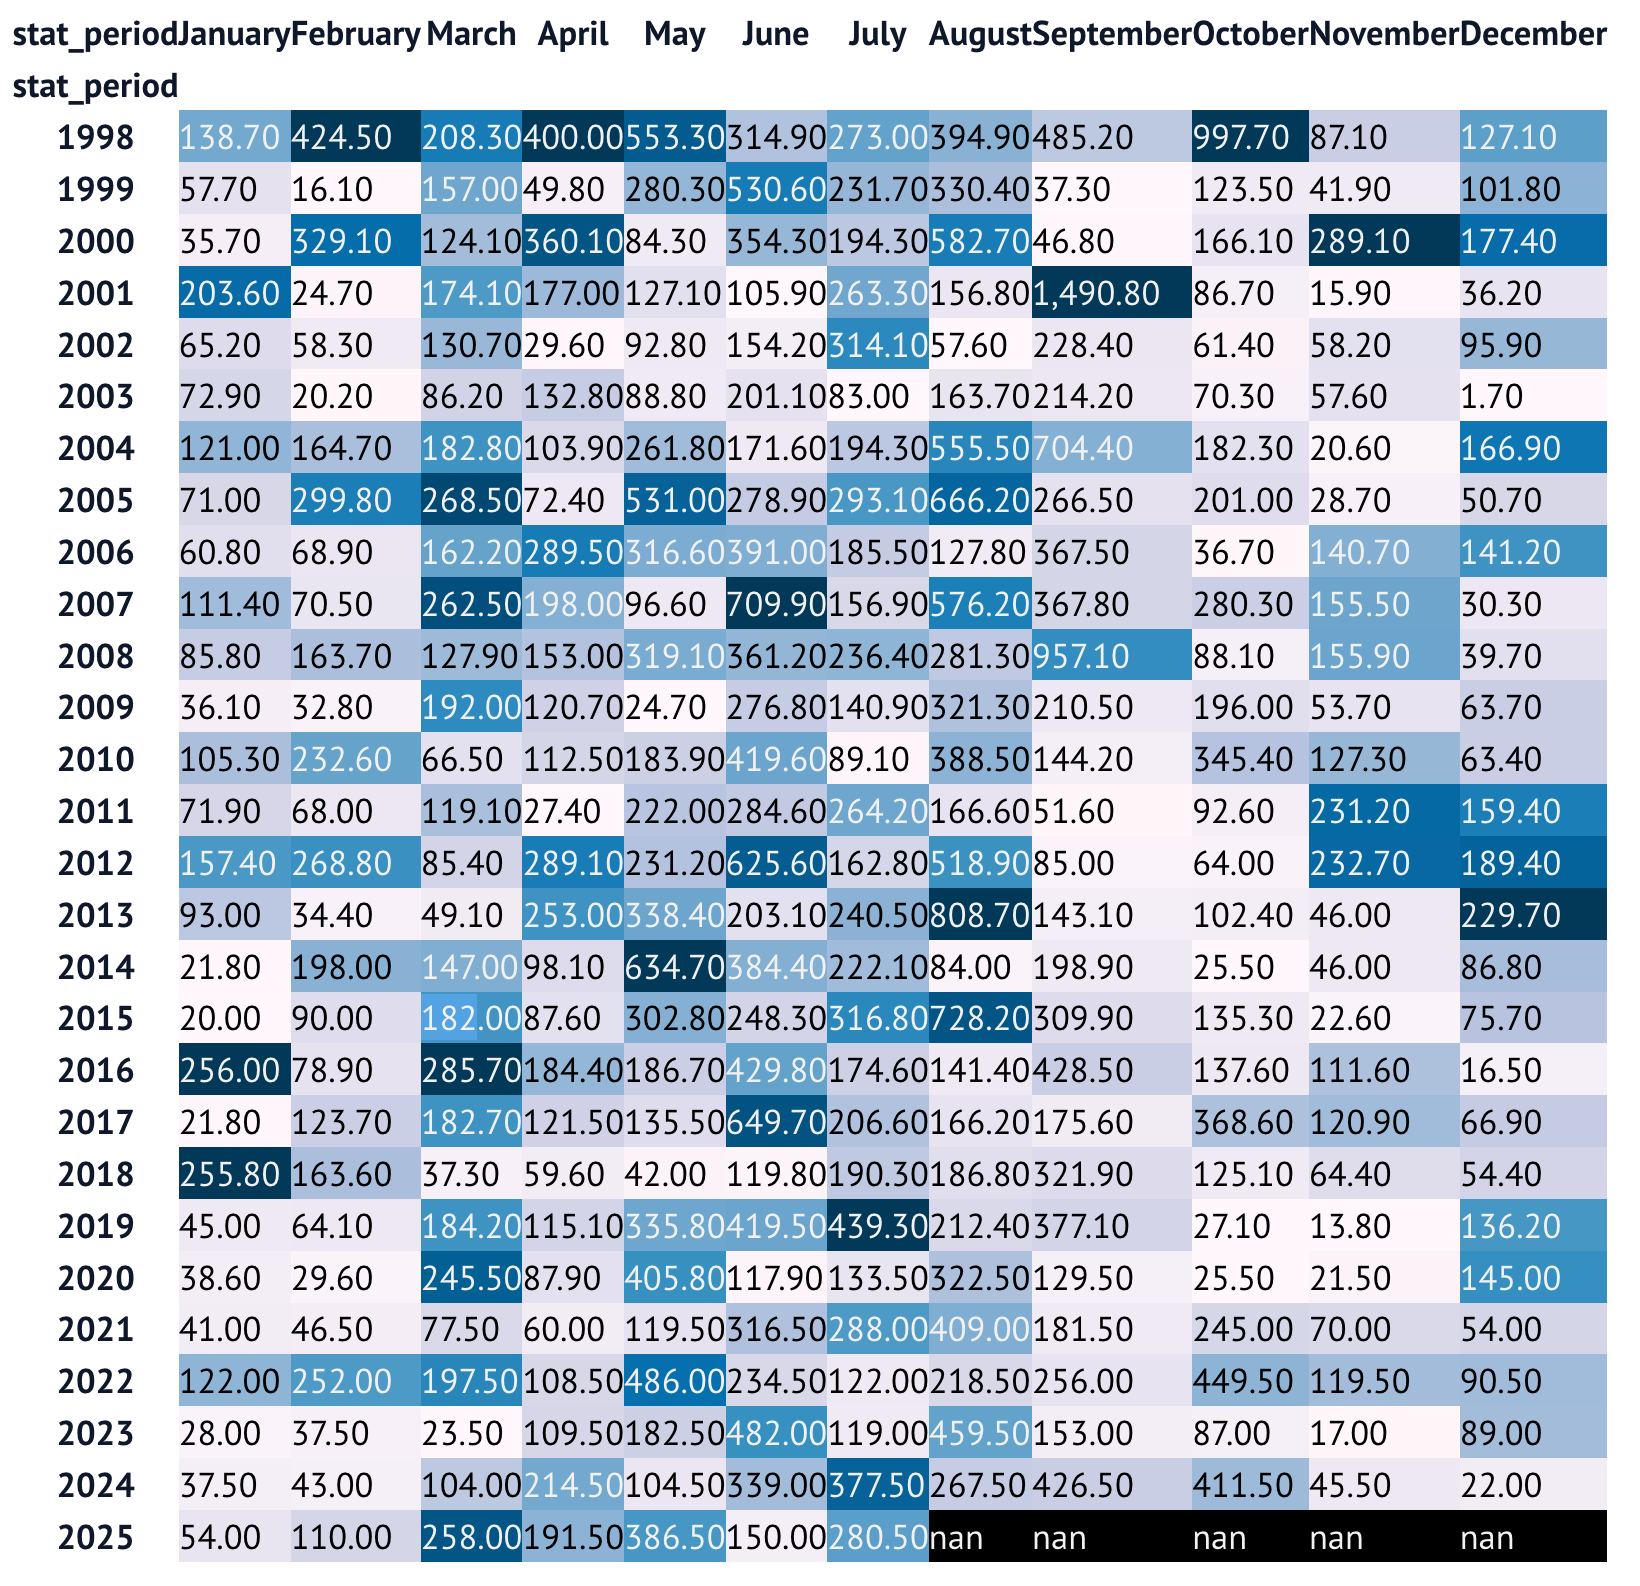
Let's ignore the fact that this could get some more help with styling the data. (And yes, I realize that styling is important! I wouldn't put this colorized data frame in a national newspaper or corporate presentation without making it nicer.)
But it does help us see, quickly and easily, that September has a relatively high amount of rain, but that it isn't the highest of the year.