


Last week, people in Spain and Portugal experienced an 18-hour power outage, causing chaos throughout both countries (https://www.nytimes.com/2025/04/29/world/europe/spain-power-outage-blackout.html?unlocked_article_code=1.FE8.aE9J.wGA5F0_NJ5qt&smid=url-share). This week's questions are thus about
I couldn't find any good data about blackouts, but I did find that the International Energy Association (IEA, https://www.iea.org/) has published statistics on how much electricity countries are generating, consuming, and exporting. So this week, we'll be comparing countries and years, seeing who is generating, importing, and exporting electricity.
This week's learning goals include cleaning data, working with dates and times, plotting, and pivot tables.
If you're a paid subscriber, then you'll be able to download the data directly from a link at the bottom of this post, download my Jupyter notebook, and click on a single link that loads the notebook and the data Google Colab.
Also: A video walk-through of me answering this week's first two questions is on YouTube at https://youtu.be/OKvHry_ezI4. Check out the entire Bamboo Weekly playlist at https://www.youtube.com/playlist?list=PLbFHh-ZjYFwG34oZY24fSvFtOZT6OdIFm !
Data and five questions
This week's data comes from the IEA's "Monthly electricity statistics" page, at https://www.iea.org/data-and-statistics/data-product/monthly-electricity-statistics#monthly-electricity-statistics . From there, you can download a CSV file containing the data we want.
Here are my solutions to the five questions and tasks that I posed yesterday:
Import the CSV file into a data frame. Make sure that the Time column is treated as a datetime value. Remove rows in which the Country column is from the OECD or IEA.
Before doing anything else, let's load up Pandas:
import pandas as pdBecause the data comes in a CSV file, it makes sense that we'll want to load it using read_csv. We can thus say:
filename = 'data/bw-117-mes-0125.csv'

df = (
    pd
    .read_csv(filename)
)
However, this fails with a "UnicodeDecodeError." What does that mean?
CSV is a text-based format. read_csv reads the data in as strings, and then parses it using the format's rules. But Python strings all use Unicode, and read_csv assumes that any file it reads is encoded using "UTF-8," in which a character might use one, two, three, or even more bytes. This contrasts with other encoding systems, in which each character is encoded using a fixed number of bytes.
Parsing a file with UTF-8 thus involves more than just reading bytes from the filesystem and turning them into characters. Python has to look at each byte, and determine if it's a one-byte character, the initial byte of a multi-byte character, or a continuing byte of a multi-byte character. Certain bytes aren't legal in certain contexts.
If you read from a non-UTF-8 file that includes non-ASCII characters, the Unicode parser will likely encounter a byte that isn't legal in that context, and cannot be parsed. That's what the UnicodeDecodeError is telling us here, that the parser got a byte that it couldn't handle.
Bottom line, it means that the CSV file is using a non-UTF-8 encoding. I wasn't completely sure which one, but decided that I could try "Latin-1", otherwise known as ISO 8859-1, a one-byte encoding that handles both ASCII characters and characters from Western European languages such as î and ñ. We can tell read_csv to use a different encoding by passing the encoding keyword argument:
df = (
    pd
    .read_csv(filename,
              encoding='Latin-1')
)
Once we've done that, we get a warning (not quite an error):
DtypeWarning: Columns (4) have mixed types. Specify dtype option on import or set low_memory=False.Remember that when Pandas reads a CSV file into memory, it has to determine the dtype of each column, choosing int64 if it can, float64 if needed, and object (i.e., Python strings) otherwise. If the file is of a non-trivial length, Pandas reads the file in chunks, making that determination for each column in each chunk. It then combines the chunks together, giving us our data frame.
But what if it makes different determinations for the same column in different chunks? It gives us the warning that we got, indicating that it wasn't able to resolve the problem ("Columns have mixed types"). One solution, as the warning indicates, is to pass the dtype keyword argument to read_csv, telling it what dtype to give each column. Another solution is to pass low_memory=False, indicating that the computer has sufficient memory to read the entire file in one pass, avoiding the need to read the file in chunks.
But in reality, this isn't the issue with our file. Rather, it's the fact that the file begins with several lines of text. Those are interpreted as columns, and as the dtypes and the number of columns in the data frame, throwing everything off.
We can solve two problems at once by passing the header keyword argument, indicating that the column names are on the 9th row of the file (which we number 8, thanks to zero-based indexing). Not only do we get our column names, but we also avoid the warning:
df = (
    pd
    .read_csv(filename,
              encoding='Latin-1',
              header=8)
)
Next, I asked you to tell Pandas to interpret the Time column as a datetime value. By default, read_csv doesn't automatically identify or parse date values, even when the date format is standard and unambiguous. (If you use the PyArrow CSV engine, via engine='pyarrow', then certain dates are automatically identified and treated that way.) The only problem is that the date format in this file might be unambiguous, but it isn't standard.
We thus pass two keyword arguments – both parse_dates, indicating that we want to treat the Time column as a datetime value, and also date_format, indicating that the dates are in a format '%B %Y', meaning a full month name and a four-digit year:
df = (
    pd
    .read_csv(filename,
              encoding='Latin-1',
              header=8,
              parse_dates=['Time'],
              date_format='%B %Y')
)
This actually works, giving us a data frame with 149,113 rows and 6 columns. However, a number of the rows don't describe countries, but rather groups of countries or summaries of the entire data set. I asked you to remove any row whose country name contains either "OECD" or "IEA".
The str.contains method returns True if a string we're looking for is inside of a string in a Pandas series. We can even use a regular expression in str.contains – indeed, regex=True is the default. We can thus look for str.contains('OECD|IEA'), which will return True if either string is found in an element of df['Country'].
We can use that inside of a combination of loc and lambda. Our lambda function takes an argument, which I call df_, to indicate that it's a data frame, but not the same one as we're still in the middle of defining (and which isn't yet available). I put a _ at the end to indicate that it's a temporary variable, a parameter to our lambda function.
But we want the lines that do not match OECD|IEA. In order to do that, we can use ~, which reverses a boolean series in Pandas, turning True into False and vice versa.
Our complete query is thus:
df = (
    pd
    .read_csv(filename,
              encoding='Latin-1',
              low_memory=False,
              header=8,
              parse_dates=['Time'],
              date_format='%B %Y')
    .loc[lambda df_: ~df_['Country'].str.contains('OECD|IEA')]
)
When we're done, df contains 131172 rows (and still six columns).
Create a bar plot showing the 10 countries that had the greatest total net electricity production in 2025.
To get such a bar plot, we'll need a series in which the index contains the country names, and the values indicate their net electricity production for 2025. For starters, we can grab the year from the Time column using dt.year, then using a combination of loc and lambda to keep only those rows from 2025:
(
    df
    .loc[lambda df_: df_['Time'].dt.year == 2025]
)
Next, we only want the rows for net electricity production. Another loc and lambda combination will do this:
(
    df
    .loc[lambda df_: df_['Time'].dt.year == 2025]
    .loc[lambda df_: df_['Balance'] == 'Net Electricity Production']
)
In looking at the data, I realized that some of the rows contained total amounts, including data from other rows. I again used ~ in combination with loc, lambda, and str.contains to remove any row in which the Product column included the word 'Total':
(
    df
    .loc[lambda df_: df_['Time'].dt.year == 2025]
    .loc[lambda df_: df_['Balance'] == 'Net Electricity Production']
    .loc[lambda df_: ~df_['Product'].str.contains('Total')]
)
Next, to find the total net electricity, from all sources, that each country produced in 2025, I used a groupby call, indicating that I want the sum from Value for each distinct Country:
(
    df
    .loc[lambda df_: df_['Time'].dt.year == 2025]
    .loc[lambda df_: df_['Balance'] == 'Net Electricity Production']
    .loc[lambda df_: ~df_['Product'].str.contains('Total')]
    .groupby('Country')['Value'].sum()
)
This gave me a series in which the index contained country names and the values were the total amount generated in each country. I invoked nlargest(10) to get the 10 largest values, and then plot.bar on that 10-element series:
(
    df
    .loc[lambda df_: df_['Time'].dt.year == 2025]
    .loc[lambda df_: df_['Balance'] == 'Net Electricity Production']
    .loc[lambda df_: ~df_['Product'].str.contains('Total')]
    .groupby('Country')['Value'].sum()
    .nlargest(10)
    .plot.bar()
)
Here is the plot I got:
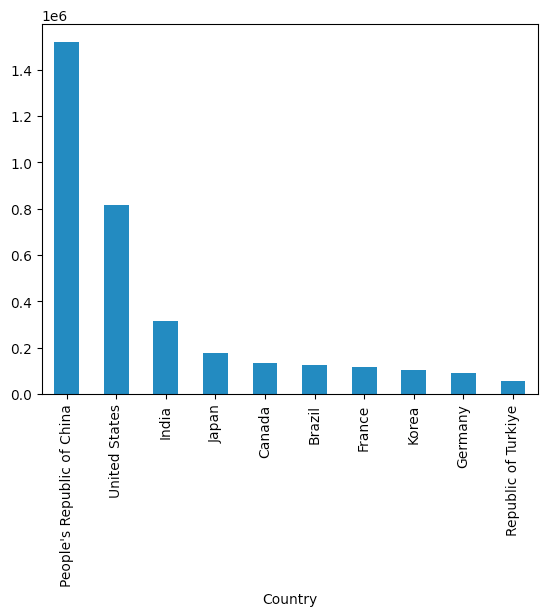
We can see that China produced the most, followed by the United States, India, Japan, and Canada.