


This week, we looked at fertilizer, and specifically nitrogen-based fertilizer that is exported from the Persian Gulf, via the Strait of Hormuz. The Haber-Bosch process for creating fertilizer (https://en.wikipedia.org/wiki/Haber_process) requires both hydrogen and energy, both of which are available in great quantities in petroleum-producing countries.
Sure enough, these countries export a great deal of fertilizer. There are serious worries about the price and/or availability of fertilizer for the world's farmers, just as planting season is starting in the northern hemisphere (https://www.nytimes.com/2026/03/27/business/economy/fertilizer-food-supply-iran-war.html?unlocked_article_code=1.XlA.uMGn.koU9YWXzVa3y&smid=url-share).
Indeed, Paul Krugman just wrote about this yesterday, after I had prepared the questions: https://paulkrugman.substack.com/p/4-gasoline-is-less-than-half-the
This week's data comes from FAO, the United Nations Food and Agriculture Organization (https://www.fao.org/). We'll see how much fertilizer comes from the Persian Gulf, and which countries depend on that fertilizer to grow their crops.
Paid subscribers, both to Bamboo Weekly and to my LernerPython+data membership program (https://LernerPython.com) get all of the questions and answers, as well as downloadable data files, downloadable versions of my notebooks, one-click access to my notebooks, and invitations to monthly office hours.
Learning goals for this week include reading CSV files, pivot tables, grouping, filtering, multi-indexes, and plotting with Plotly.
Data and five questions
This week's data comes from the FAO, and specifically from FAOSTAT. The data-download page for fertilizer trade is at https://www.fao.org/faostat/en/#data/RFM ,
I went to this page, and clicked on the "all data" link, which downloaded a 41 MB zipfile to my computer. We'll use one of the files from there, the "all fertilizers trade matrix, no flag" CSV file.
Here are the solutions and explanations for this week's five questions:
Read the "all fertilizers trade matrix, no flag" CSV file into a Pandas data frame. Keep only the rows where Element is 'Export quantity (tonnes N)'. Create a three-level multi-index from Reporter Countries, Partner Countries, and Item, then keep only the year-related columns.
Let's start, as usual, by importing needed libraries:
import pandas as pd
from plotly import express as px
Next, I used read_csv to read data from the file on disk into a CSV file. I used the pyarrow engine, because I generally prefer to use it when I can. It's faster and more modern, even if it is sometimes a bit too strict in parsing CSV files:
filename = 'data/bw-164-fao-data.csv'

df = (
    pd
    .read_csv(filename, engine='pyarrow')
)
But wait, we only needed those lines that had to do with nitrogen-based fertilizer. Moreover, the FAO data includes information from importers and from exporters. The reporting country indicates whether it's importing or exporting, and while there should be some matching data in the other direction, there isn't always. (I thought about asking questions about those matches or mismatches, and ended up not doing it.)
Bottom line, we only needed those lines with 'Export quantity (tonnes N)' as the Element. To retrieve only those rows, we can use .loc and then put a condition inside of the []. Wherever the condition returns True, we'll keep the rows. In this case, the condition uses pd.col (new in Pandas 3!) – we name the column, and then use == to say what it should equal:
filename = 'data/bw-164-fao-data.csv'

df = (
    pd
    .read_csv(filename, engine='pyarrow')
    .loc[pd.col('Element') == 'Export quantity (tonnes N)']
)
Next, I used set_index to grab three (!) columns and make them into a three-part multi-index. Why all three columns? Partly because I think they represent the data well, with the reporter country (the exporter), the partner country (the importer), and what they're exporting.
But the other reason to use these in the index is that we can then use filter with a regular expression to keep only those columns that start with a Y and then have four digits. We can do that with the '^Y\d{4}$' regular expression, which means:
^- Anchor the regexp to the start of the stringY- Look for the literal characterY\d- look for one decimal digit, 0-9{4}- look for 4 characters in a row that match the previous metacharacter, meaning 4 digits in a row$- Anchor the regexp to the end of the string
Bottom line, we only want 5-character columns, containing the years for which we have data:
filename = 'data/bw-164-fao-data.csv'

df = (
    pd
    .read_csv(filename, engine='pyarrow')
    .loc[pd.col('Element') == 'Export quantity (tonnes N)']
    .set_index(['Reporter Countries', 'Partner Countries', 'Item'])
    .filter(regex=r'^Y\d{4}$')
)
The result is a data frame with 54,587 rows and 34 columns. All of those columns have a dtype of float64, with the quantity of various nitrogen-based fertilizers exported in each year.
Persian Gulf states are normally defined as Saudi Arabia, Bahrain, Iran, Iraq, Oman, Qatar, Kuwait, and the United Arab Emirates. Create a stacked bar plot, showing how much total fertilizer each country exported over the years for which we have data. Then create a stacked bar plot showing Persian Gulf exports of urea (one type of fertilizer) as a part of total world fertilizer exports for each year.
I first defined a Python list of strings, containing the names of countries in the Persian Gulf:
persian_gulf_states = ['Saudi Arabia', 'Bahrain',
                       'Iran (Islamic Republic of)', 'Oman',
                       'Iraq', 'Qatar', 'Kuwait', 'United Arab Emirates']
Notice the name of Iran isn't just 'Iran' but is instead 'Iran (Islamic Republic of)'. That's the official name, and why you'll encounter errors if you try to retrieve from the data frame just using Iran .
With this list in place, how can we get only the rows corresponding to exports from Persian Gulf countries? We can again use .loc, passing the list as an argument.
How does this work?
- We can always put a list of values inside of
.loc[]in Pandas. That's treated as a "fancy index," and retrieves all of the rows that correspond to the index value. - But wait, here we have a multi-index. Fortunately, if we only pass a single value (or a list of values), then we only have to match the outermost layer. Passing a tuple, by contrast, would try to match each of the layers of the multi-index.
We can thus keep only the rows from Persian Gulf states with:
(
    df
    .loc[persian_gulf_states]
)
We wanted to know the total amount exported by each country in each year. For that, we can use groupby, summing all of the columns. This will give us the total amount, per country, and per year.
Notice that after you have moved a column into the index, you cannot normally retrieve from it or work on it using its name. But for odd (but useful!) reasons, you can reference a column that is in the index when you use groupby:
(
    df
    .loc[persian_gulf_states]
    .groupby('Reporter Countries').sum()
)
I then decided to invoke sort_values, in order to get the countries sorted in what I thought was a more obvious, aesthetic way:
(
    df
    .loc[persian_gulf_states]
    .groupby('Reporter Countries').sum()
    .sort_values('Y2023')
)
Good news! We can now get a stacked bar plot by invoking px.bar. We'll run that through pipe, so that the data frame we got back from sort_values is passed as an argument...
... except that the result will be useless, and not at all what we wanted. That's because they'll be on the wrong axes, We want each year to be a separate bar, which means they need to be the rows – and they're the columns after the groupby. To fix this, I used T, the short form of transpose, which turns rows into columns and columns into rows. Then I invoked pipe(px.bar):
(
    df
    .loc[persian_gulf_states]
    .groupby('Reporter Countries').sum()
    .sort_values('Y2023')
    .T
    .pipe(px.bar)
)
Here's the plot I got:
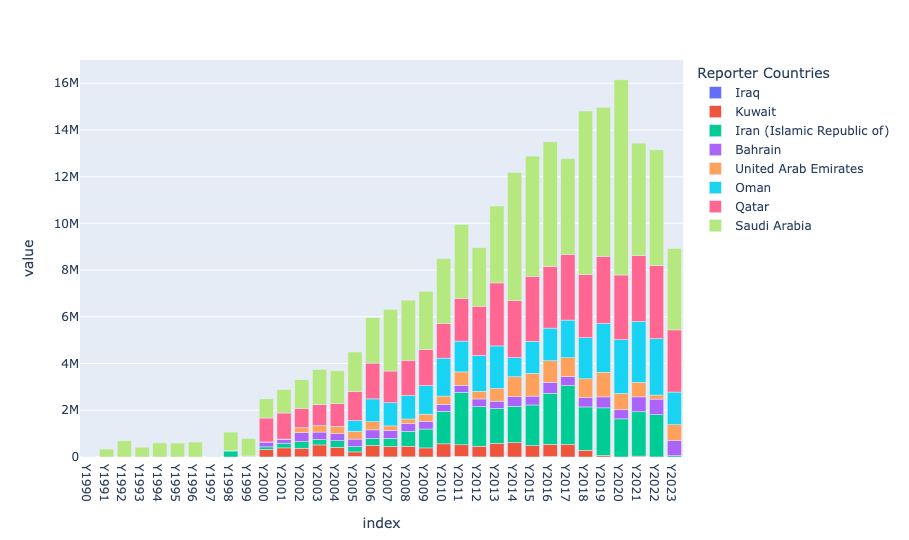
We can see that fertilizer exports from the Persian Gulf only started in a serious way in the year 2000 or so, in Saudi Arabia. But the entire region has gotten involved, and now produces enormous quantities of various types of nitrogen-based fertilizer. We can see that Saudi Arabia is the leader, with Qatar pretty close behind. Iran is no slouch, either, exporting about half as much as Qatar and about a third as much as Saudi Arabia.
How much urea (a prime example of a nitrogen-based fertilizer) is exported from the Persian Gulf, as opposed to other parts of the world? To find out, I wanted to grab those rows in which Item is equal to 'Urea'. But there's a problem; the Item column is now part of the index. I could use reset_index to return it to being a "regular" column, and then use .loc to select those rows.
But a better (more elegant) solution is to use xs, which lets us query our data frame's index using a cross section. Here, I asked for where the index value is 'Urea', but only in the level Item:
(
    df
    .xs('Urea', level='Item')
)
I then did use reset_index, returning Reporter Countries to be a regular column. That's because I wanted not to use it to determine whether a row referred to a Persian Gulf country or now. I used assign, then used isin to determine whether the Reporter Countries value for each row was in persian_gulf_states. The result was a boolean column, where True indicates that the exporter is in the Persian Gulf, and False indicates that it's from the rest of the world.
I then used drop to remove the Reporter Countries column, since we didn't need it any more:
(
    df
    .xs('Urea', level='Item')
    .reset_index('Reporter Countries')
    .assign(is_persian_gulf = pd.col('Reporter Countries').isin(persian_gulf_states))
    .drop(columns='Reporter Countries')
    .groupby('is_persian_gulf').sum()
    .T
    .pipe(px.bar)
)
I then repeated my technique from the previous question, but grouping on is_persian_gulf rather than the individual countries:
(
    df
    .xs('Urea', level='Item')
    .reset_index('Reporter Countries')
    .assign(is_persian_gulf = pd.col('Reporter Countries').isin(persian_gulf_states))
    .drop(columns='Reporter Countries')
    .groupby('is_persian_gulf').sum()
    .T
    .pipe(px.bar)
)
Here's the plot:
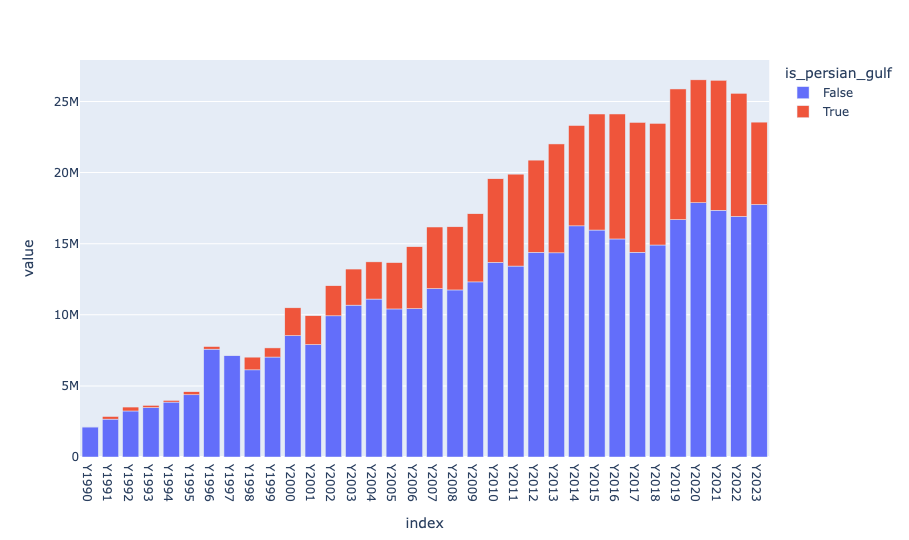
You can see that in 2023, among exporters of urea, Persian Gulf countries accounted for about one quarter worldwide. If that urea isn't currently getting out, then farmers are going to scramble – and pay – to get the fertilizer they need as planting season begins.