


Telework
This week, we looked at data about telework (i.e., working from home) from September that was recently released and discussed by the Bureau of Labor Statistics at the US Department of Commerce. Their report was based on the Current Population Study conducted by the US Census Bureau (https://www.census.gov/programs-surveys/cps.html). BLS summarized the current state of affairs in a short article (https://www.bls.gov/opub/ted/2023/nearly-half-of-workers-in-financial-activities-teleworked-in-september-2023.htm), showed that about half of people working in the financial industry were working from home.

However, in contrast to our usual data analysis using Pandas, I instead asked you to use Polars (https://www.pola.rs/). Polars isn't a drop-in replacement for Pandas, but because it offers a Pandas-like API, many people see it as a faster, cleaner, more efficient library with lazy loading and a smart query engine. I’ve been playing with Polars over the last few weeks, and given the large number of questions I’ve received about it, I though it would be a good idea to use it this week.
Data and six questions
This week, we looked at some of the data behind the BLS article, summarized at https://www.bls.gov/cps/telework.htm . We'll specifically look at data in the latest report, from September 2023:
https://www.bls.gov/cps/telework/telework-tables-2023-09.xlsx
Here are my questions; a link to the Jupyter notebook I used to solve these problems is at the bottom of the solutions.
Use Polars to retrieve the Excel file for September 2023. We're interested in the data from Table 2, showing the percentages of people working from home with different occupations. This means that we'll want the subset of the spreadsheet from G11 to K39. Rename the columns to something easier to remember and understand.
Before we can do anything else, we’ll need to install Polars. If you haven’t done so already, you can install it — along with all of its extensions — from the command line with:
pip3 install -U 'polars[all]'The extensions allow Polars to work with data from a variety of different sources and data types, including Excel — which we’ll need to work with our data. If you have the disk space and bandwidth, I would generally encourage you to include all of the extensions, since you never know when you’ll be reading from various formats.
With that in place, you can then load Polars into Python:
import polars as plJust as you can use Pandas without aliasing it to “pd”, you can theoretically use Polars without aliasing it to “pl”. But please don’t, unless you want to give your colleagues a reason to hate you.
Now that we’ve loaded Polars, we can read the Excel file into a data frame. In Pandas, we do this using the “read_excel” function. In Polars, we do it using the … “read_excel” function:
filename = 'telework-tables-2023-09.xlsx'
df = pl.read_excel(filename)
Note that Polars, like Pandas, can retrieve an Excel file from the Internet by giving it a URL in a string. However, the BLS site gave me an error every time I tried to do this. I ended up downloading the file via my browser, and then opening it using read_excel.
It’s important to note that the above call to read_excel won’t work. Why not? Well, there are a whole bunch of reasons:
- We want to load data from the sheet named “Table 2”
- We want to specify particular rows and columns
- We want to indicate that the Excel file doesn’t have any headers
- We want to rename the columns after we read in the data frame
In Pandas, we can pass a “sheet_name” keyword argument to read_excel, and specify which sheet we want to load. The same is true in Polars:
df = pl.read_excel(filename
                  sheet_name='Table 2')
The above will return a data frame — a Polars data frame — with the contents of the “Table 2” sheet, which looks like this on my computer:
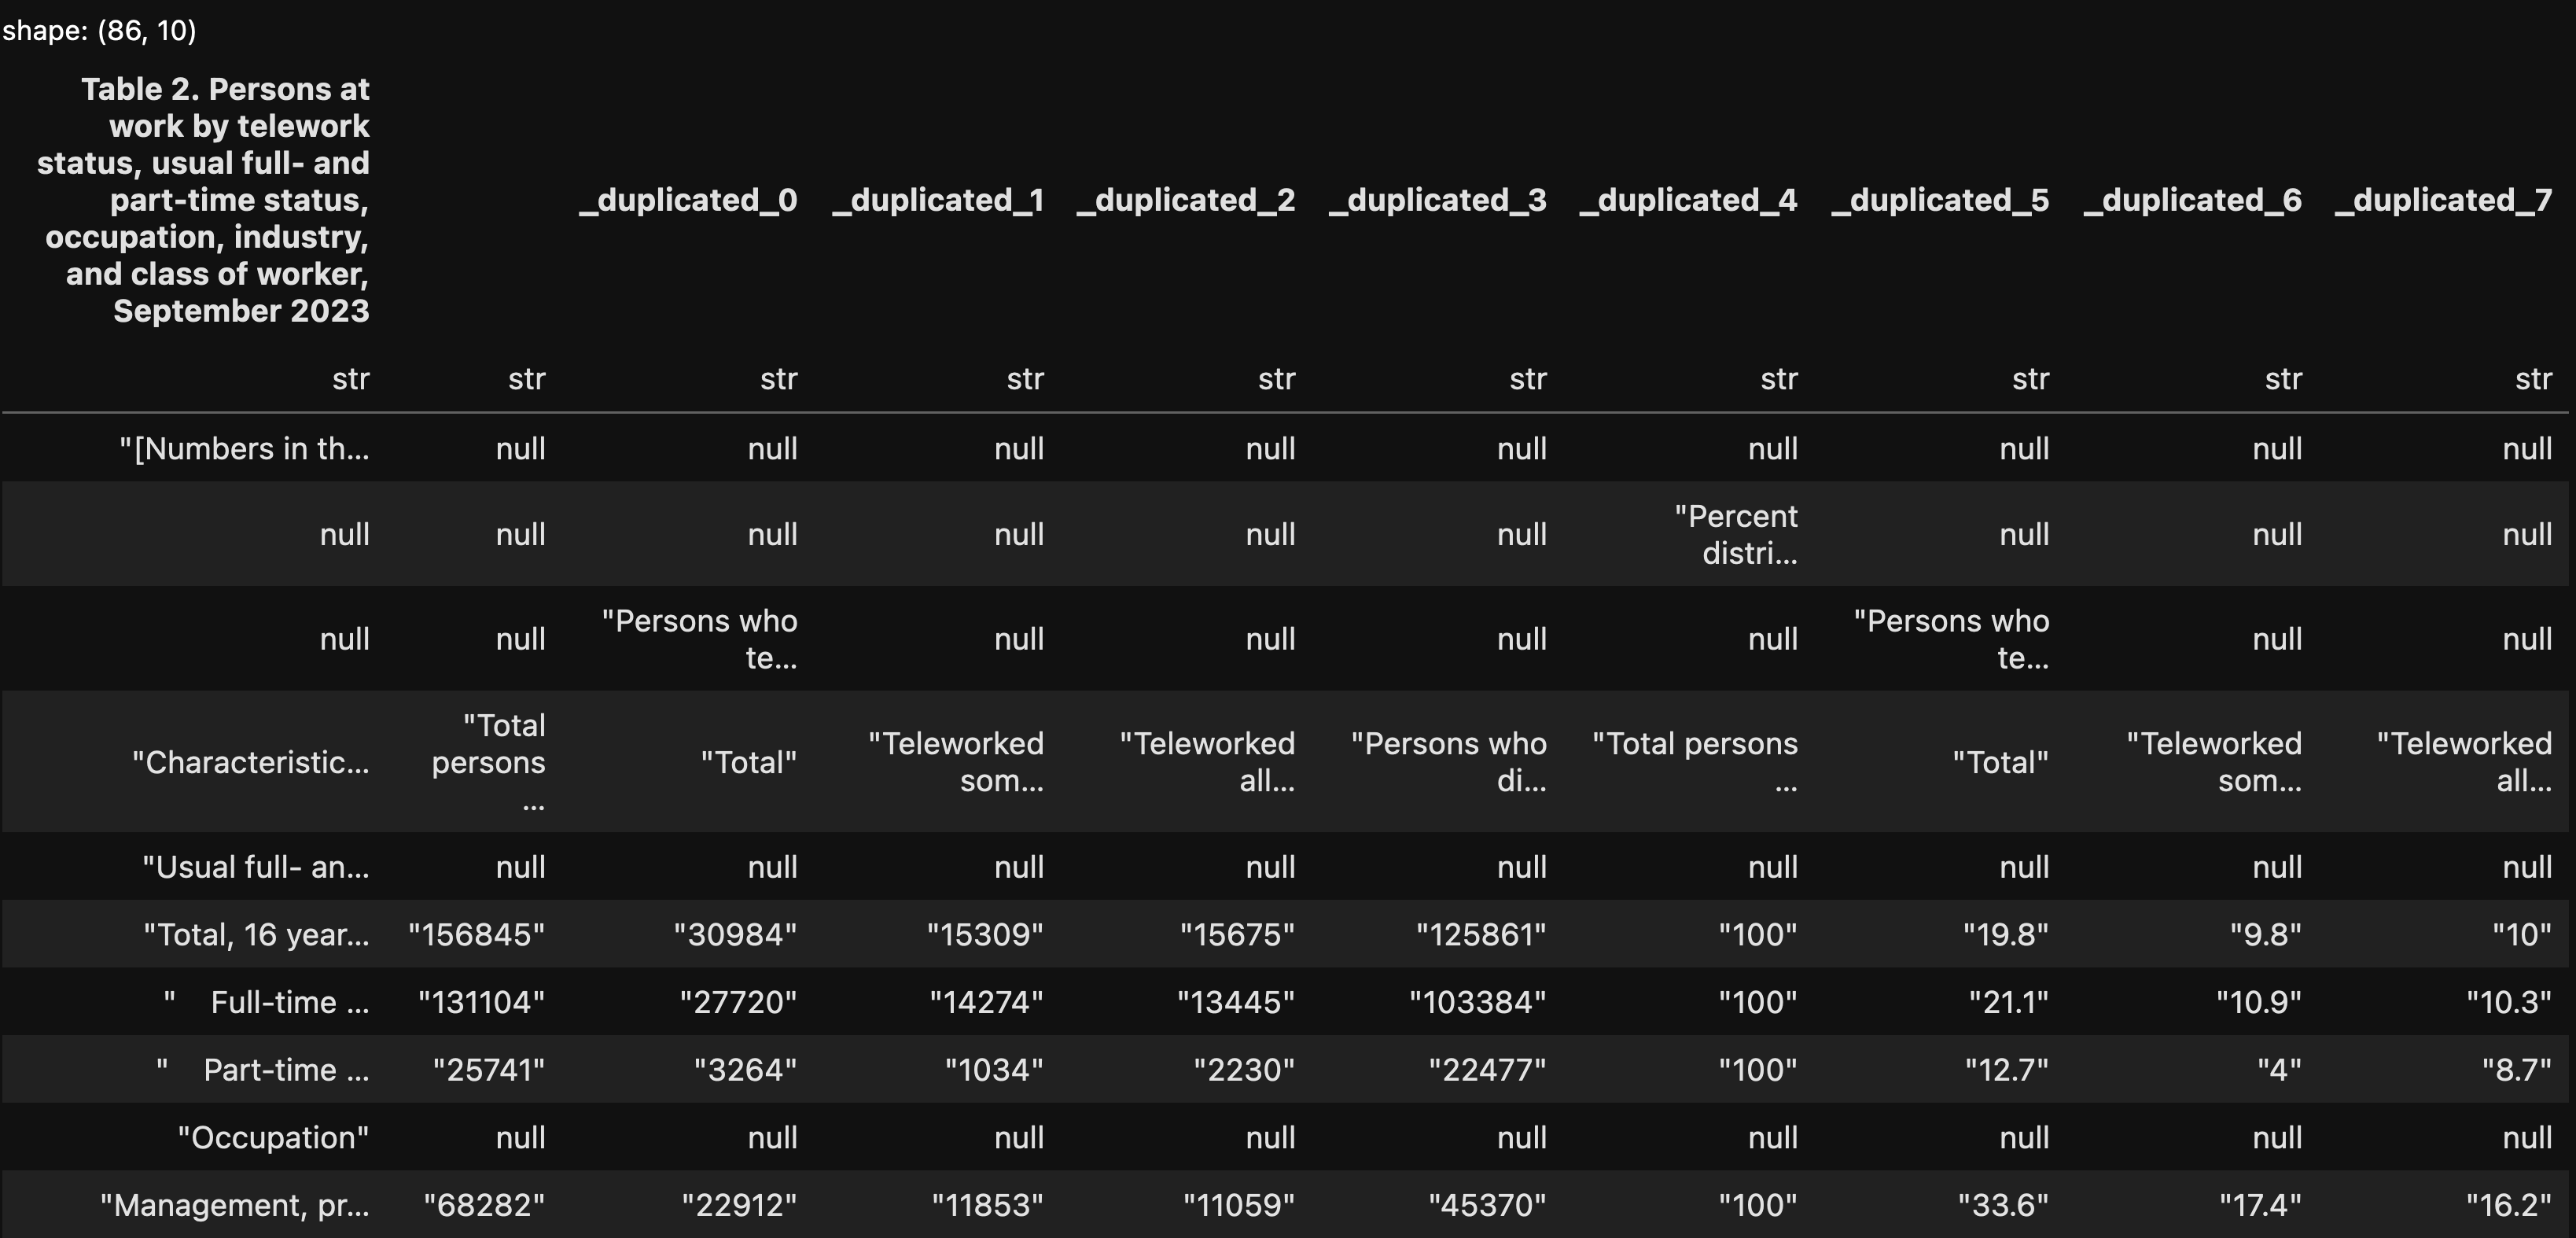
This isn’t what we’ll get in the end, but you can already see some of the similarities and differences between Pandas and Polars when viewing this data frame:
- Data frames in both libraries are two-dimensional tables, with rows and columns.
- In both, each column has a unique name.
- In both, each column has a specific dtype — but in Polars, the dtype is displayed when we view the data frame. This is a nice little touch that I wouldn’t mind seeing in Pandas.
- Perhaps the biggest difference between the libraries is that Polars data frames don’t have an index. That’s right; the key (no pun intended) part of a Pandas data frame, which we use to retrieve specific rows, just doesn’t exist. I thought that this was weird, and would make it difficult or impossible to work with Polars in a normal way. It turns out that the index is a convenience, but not a necessity, as we’ll see in a bit.
Notice that all of the columns have a dtype of “str”. That’s because we read all of the rows and all of the columns, and given all of the instructions, header rows, and the like, Polars was pretty constrained regarding what it could do.
In Pandas, I would be able to skip the first 12 rows in the file, read only 29 rows, only read some of the columns, and then rename those columns in a way that makes more sense to me. How can I do that?
If you skim through the read_excel documentation for Polars, you won’t see any options that allow for such things. However, you will see a keyword argument, “read_csv_options”, which takes a dictionary value. We can create a dict containing the appropriate key-value pairs, and they will be turned into keyword arguments when read_csv is passed.
Wait — huh? Aren’t we reading an Excel file? How do CSV files enter into this discussion?
One of the Polars extensions that we installed is called xlsx2csv, and its job (as you can guess from the name) is to take Excel files and turn them into CSV file. My guess, without looking too deeply into things, is that Polars reads the Excel file, applies whatever keyword arguments have been passed to it, and then turns the resulting data into a CSV file.
I thus created a Polars data frame from the Excel file with the following:
df = pl.read_excel(
            filename,
            sheet_name='Table 2',
            read_csv_options={'has_header':False,
                              'skip_rows':12,
                              'n_rows':29,
                              'columns':[0,7,8,9,10],
                              'new_columns':['Occupation',
                                             'Telework total pct',
                                             'Telework part-time pct',
                                             'Telework full-time pct',
                                             'No telework pct']})
The above:
- Reads from the Excel file’s sheet “Table 2”
- Doesn’t set any column names from the Excel file
- Skips 12 rows before starting to read anything
- Only reads 29 rows into the data frame
- Only reads from a selected list of columns
- Names the columns in the resulting data set
I’ll admit that the “new_columns” keyword argument is … not super obvious to me.
After running the above code, here’s what I got as a data frame:
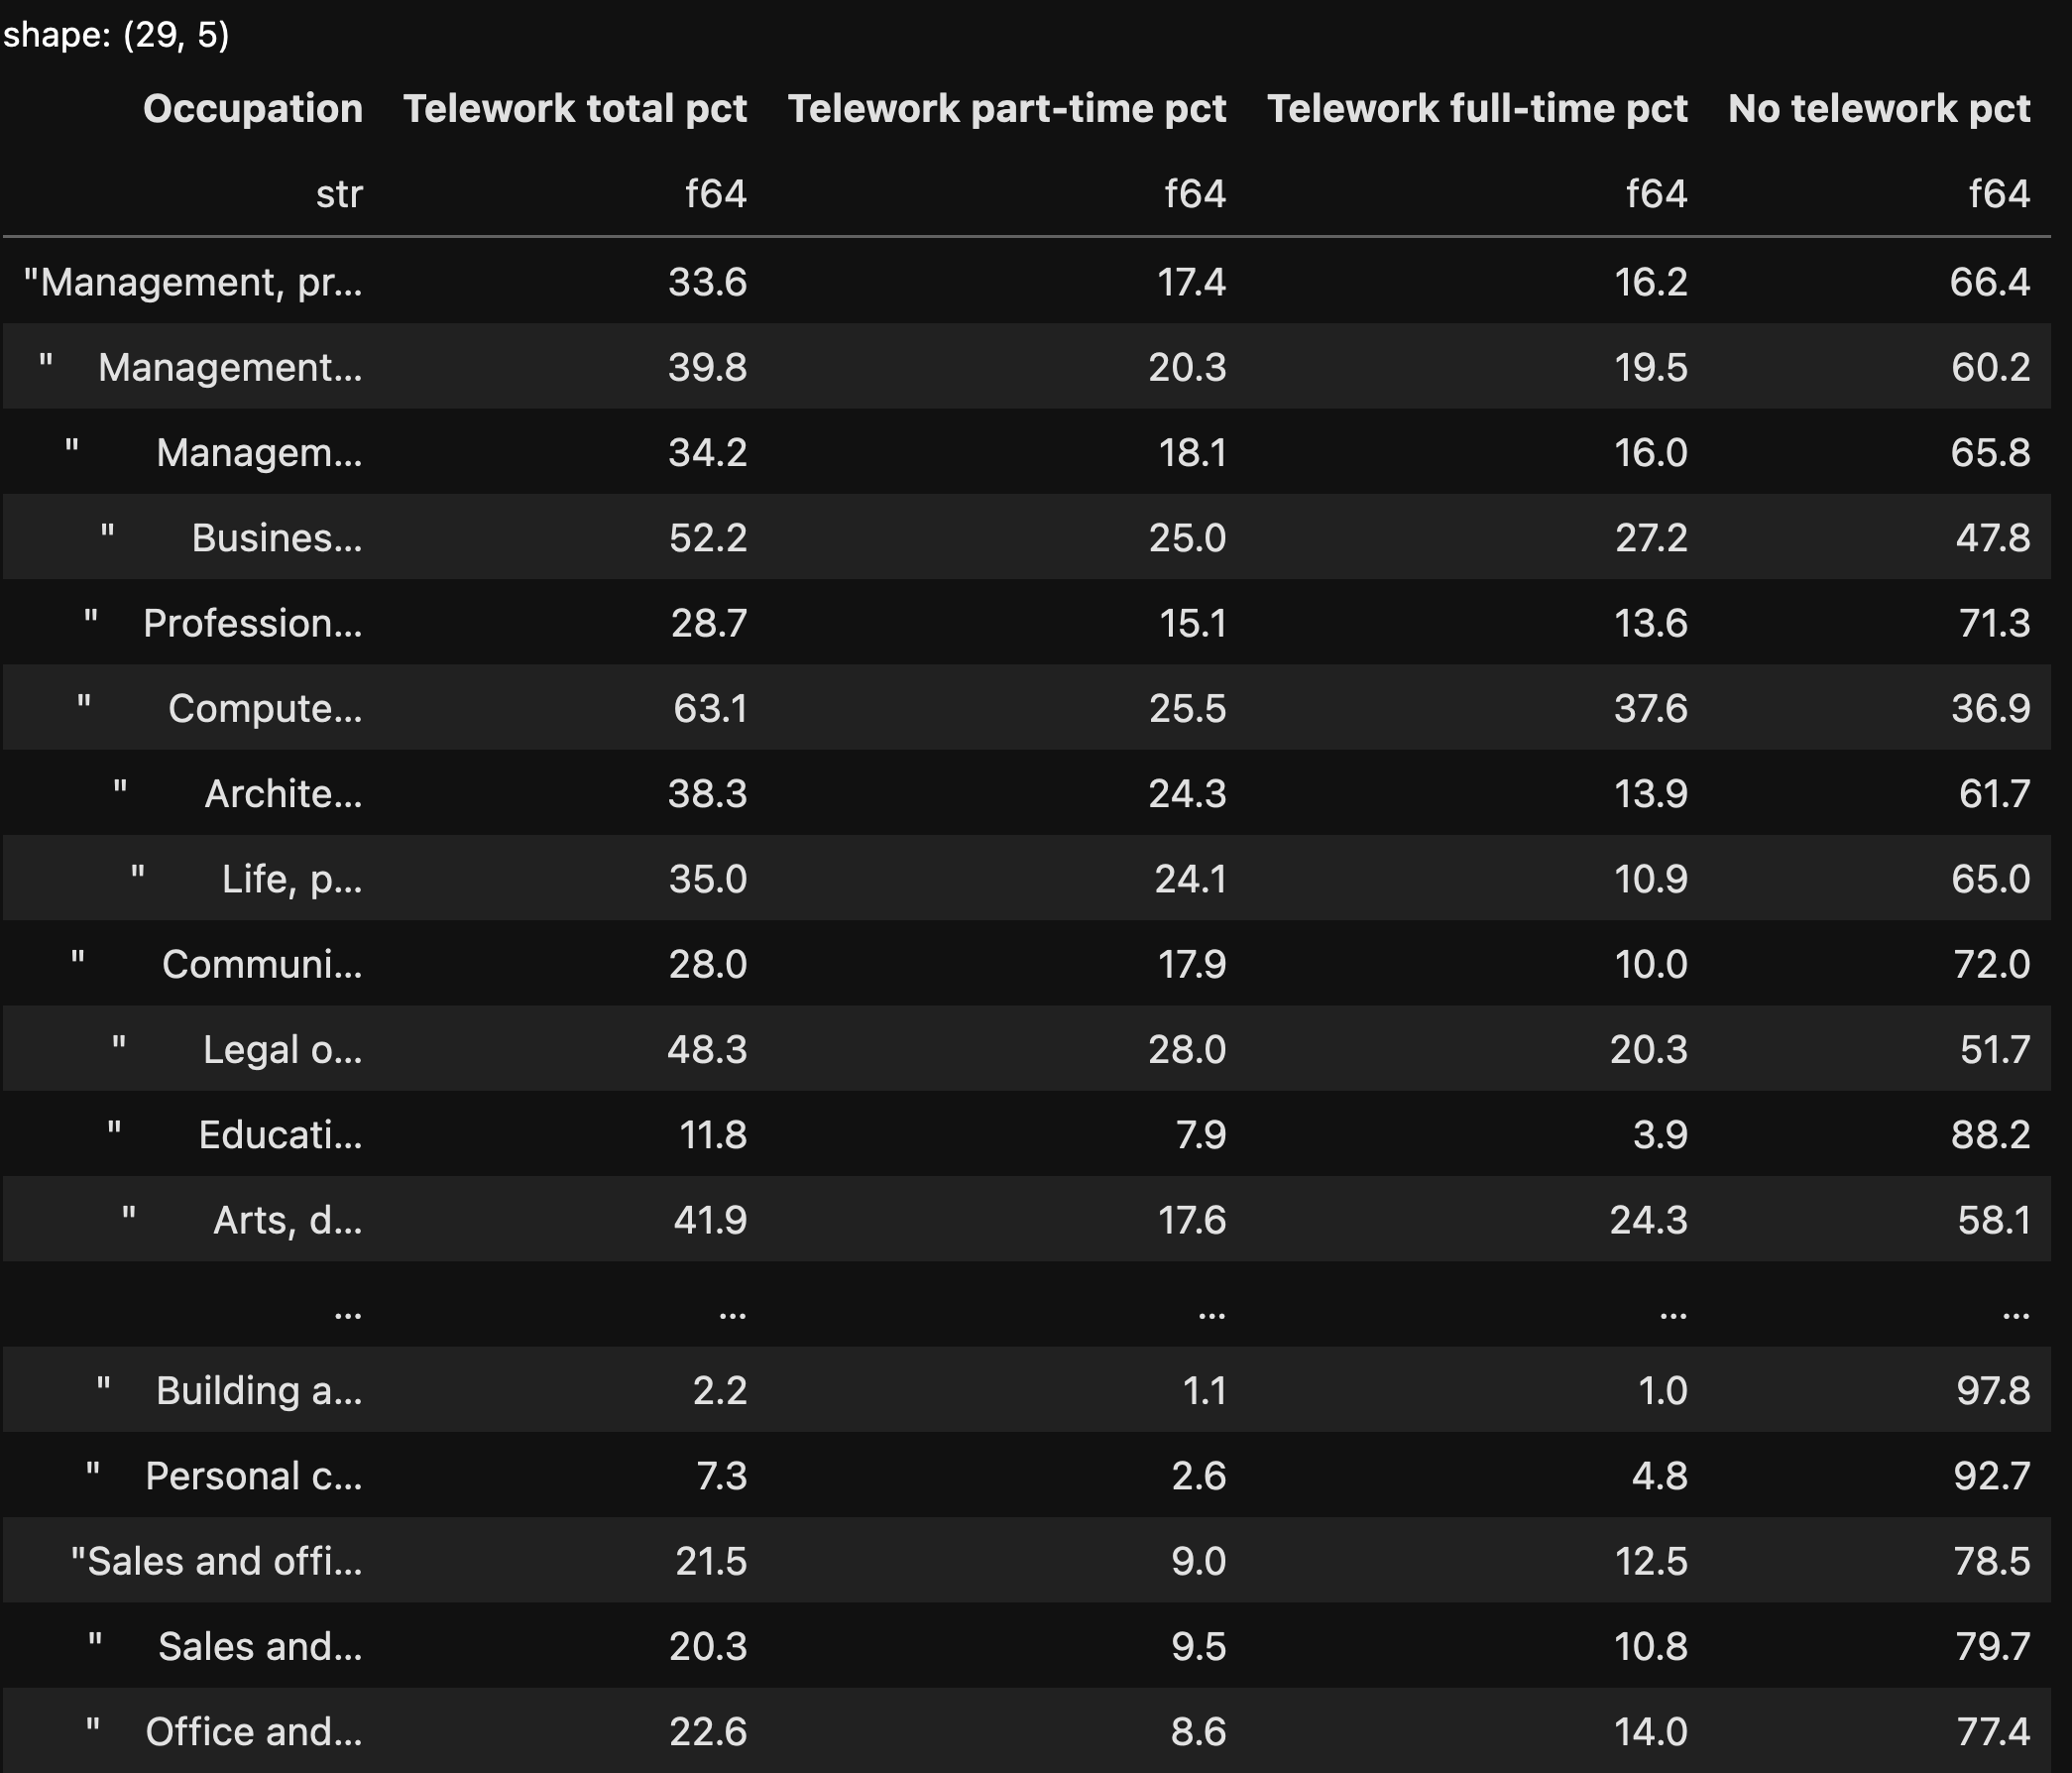
I do really like seeing the shape of the data frame (in the top-left corner) and the dtypes in the column headers. We can see that the “Occupation” column contains the names of the occupations, and is a string column, but that all four of the other columns are 64-bit float values.
We now have our data frame, and can start to analyze it.
Show only those rows having to do with major occupational categories (i.e., ignoring the subcategories). Which three had the greatest percentage of teleworkers, either part- or full-time? Show the full name of the category, along with the total percentage of teleworkers.
The first task I want to do is choose only those rows showing major categories. The original Excel document differentiated between them using indentation; those that were flush left were major/top-level categories, whereas those with spaces before the names were minor/mid-level categories. How can we get only the major categories?
The Polars “filter” method lets us choose which rows we want to see from a given data frame. We then pass, as an argument to filter, a Polars expression describing what we want to see.
In this case, we want to find all rows where the “Occupation” column’s text is flush left, without any spaces before it. One way to find such rows is with a regular expression. (Scared of regular expressions? Take my free, 14-part “Regexp Crash Course” and you’ll see that they’re not that bad after all.)
In Pandas, I would choose a column, and then use the “str” accessor to apply a particular method to it. I could then use the “contains” string method to apply a regular expression, indicating that the string value should start with an alphanumeric character.
In Polars, I can do just about the same thing, except that I describe the column using “pl.col”. Here’s how I can find all of the rows whose “Occupation” column is flush left, without any whitespace before the first letter:
(
    df.filter(
     pl.col('Occupation').str.contains('^\w')
    )
)
The above code returns the following data frame:
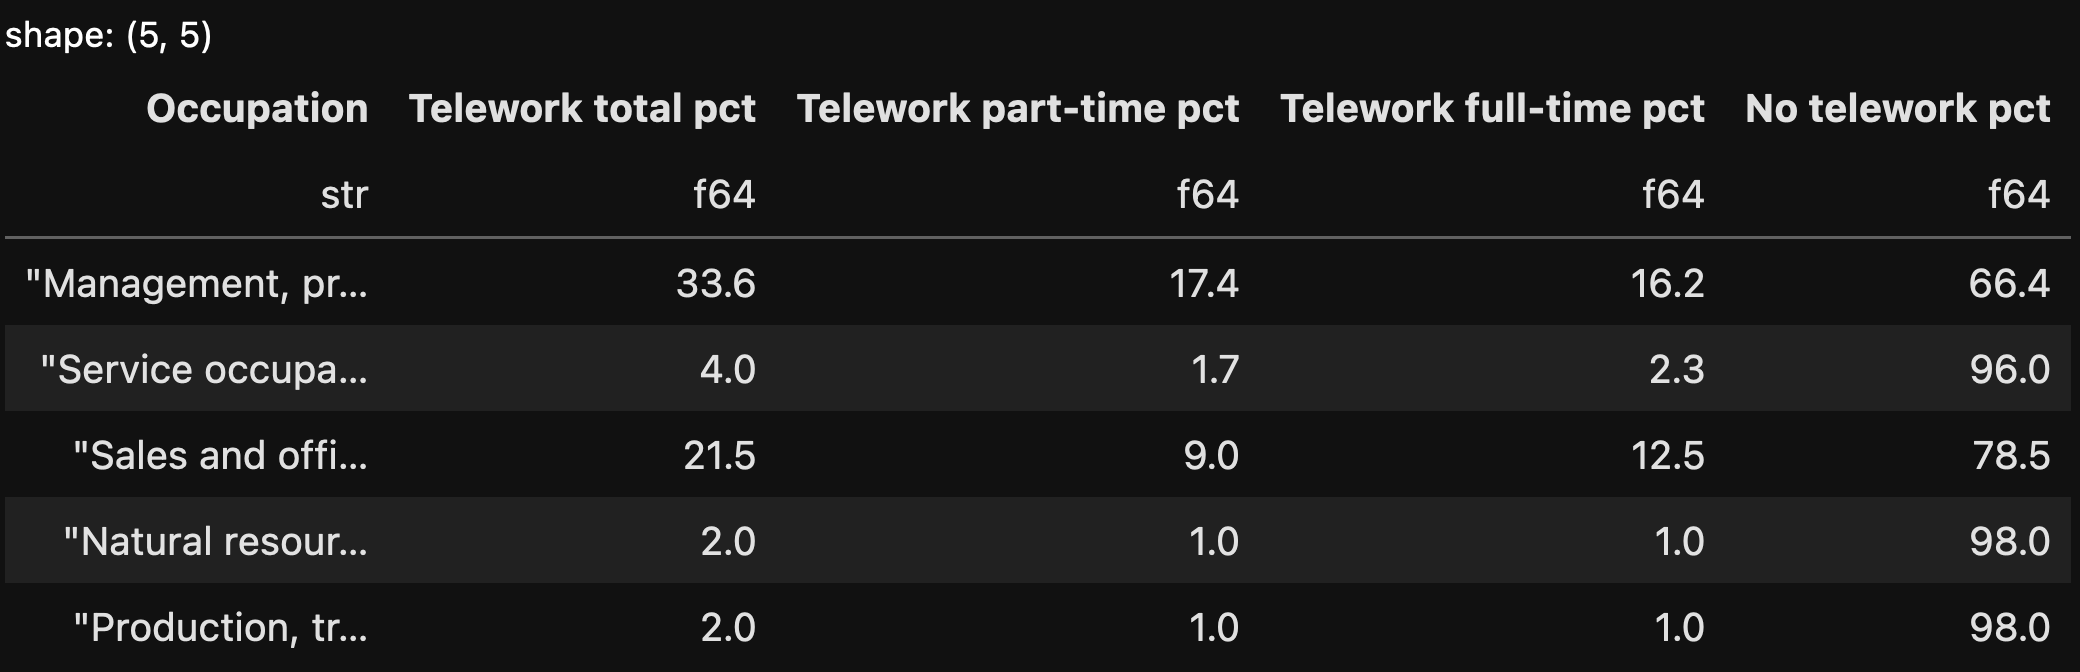
A good start! But I wanted to know which three occupations had the greatest percentage of teleworkers (either full- or part-time). We can get that percentage from the “Telework total pct” column, but how can we sort by that column?
With the “sort” method, much as we would do in Pandas. (In Pandas, we actually have distinct “sort_index” and “sort_values” methods. Since Polars data frames don’t have an index, the method is just called “sort”. We can run this on the result we get from the filtering:
(
    df.filter(
     pl.col('Occupation').str.contains('^\w')
    )
    .sort('Telework total pct', descending=True)
)
Here’s what we get from this query:
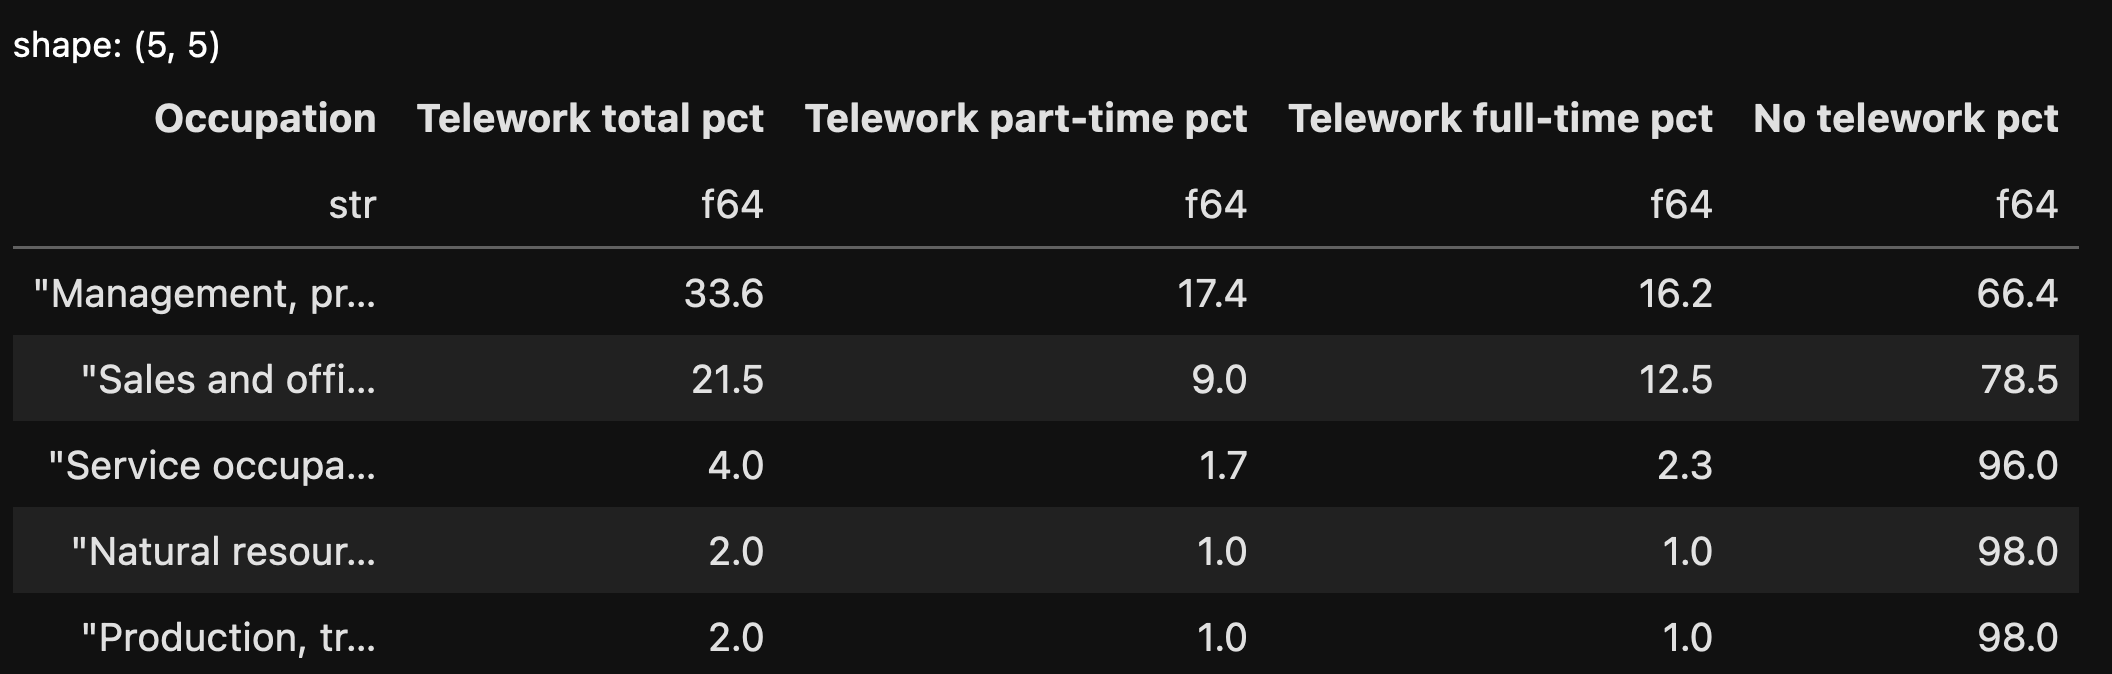
Notice that I passed the “descending=True” keyword argument, which means that we got the rows in descending order.
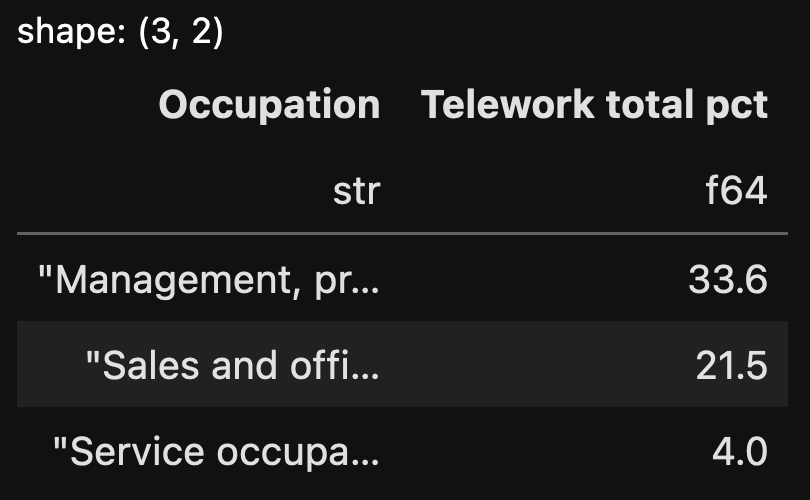
Finally, I want to choose just the first three rows. I can do that with “head”, which works almost identically to Pandas. And then I’ll indicate which columns I want to display with the “select” method, which allows us to select specific columns. The final query looks like this:
(
    df.filter(
     pl.col('Occupation').str.contains('^\w')
    )
    .sort('Telework total pct', descending=True)
    .head(3)
    .select('Occupation', 'Telework total pct')
)
The data frame we get looks like this:
As you can see, the syntax is a bit different from Pandas, but the ideas aren’t too different, at least when things are fairly simple.